Results
Performance monitoring
KPI development
The "Key Performance Indicator (KPI)" and the "Overall Equipment Efficiency (OEE)" are refreshed in the following time intervals:
-
If predefined time intervals (e.g. "Today" or "Current Month") are selected, then the KPI/OEE results are always refreshed 10' and 40' after the full hour.
Predefined time intervals also include the data of the current workday.
-
If a user-defined time interval is selected, then the requested data is immediately calculated.
If the user-defined time interval includes the current workday, then data is refreshed 10' and 40' after the full hour.
The OEE formula for "Analyze MyPerformance /OEE Monitor" has the following composition:
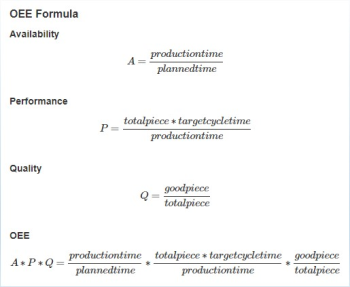
If you have activated "Analyze MyPerformance /OEE Tuning", the formula that you set under "Configuration" for the Analyze MyPerformance /OEE Tuning Assets is used.
You will find further information on processing the KPI calculation under: Editing the KPI calculation.
Procedure
-
The "Performance Monitoring" window is open.
-
Clicking on the small arrow opens the drop-down "Asset List".
The list of available machines is displayed.
-
Select the required control system (machine) using the mouse.
The machine is displayed in the input field and as machine button together with the following data.-
Name
-
Machine type
-
Location
-
SINUMERIK version
-
Machine status: The following data are displayed:
Machine offline
Unknown
Production
Technical disturbance
Organizational disturbance
Disturbance without technical or organizational reasons
-
-
Press the button of the corresponding asset.
Analyze MyPerformance /OEE Monitor Asset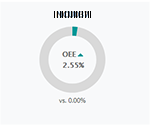
Analyze MyPerformance /OEE Tuning Asset
-
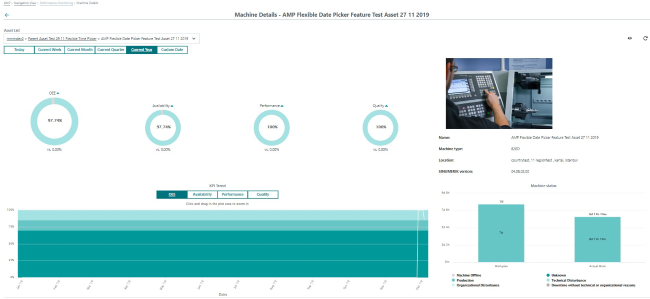
Window "Machine Details" opens.
Press the button for the desired time interval. The KPI value for the selected time interval is displayed.-
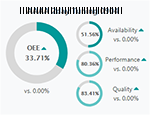
You can see the KPI value as a percentage in the circles.
-
The KPI value is graphically shown in the "KPI trend diagram".
Select the required monitoring parameter in order to display the KPI trend:
-
OEE
-
Availability
-
Performance
-
Quality
You can edit the designations of the KPI labels "Availability", "Performance" and "Quality" with Analyze MyPerformance /OEE Tuning.
Further information on this can be found under: Editing the display. -
Analyze MyPerformance /OEE Monitor
Analyze MyPerformance /OEE Tuning
The color of the display in the figure has been edited with Analyze MyPerformance /OEE Tuning.
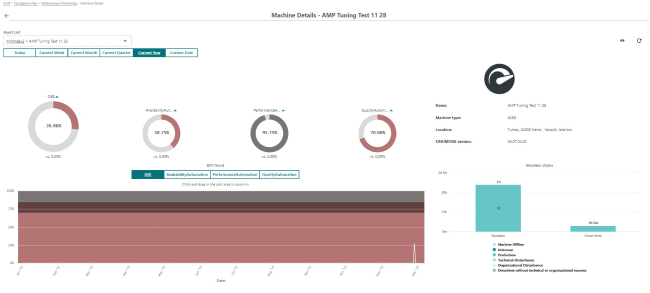
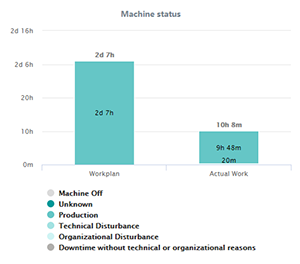
Machine status
The duration of the planned machine status (work plan) and the duration of the actual machine status (actual work) are shown juxtaposed in the machine status. You have the option of displaying and hiding an individual machine status.
-
Click on the machine status below the bar diagram.
The selected machine status is displayed or hidden in the overview.