Results
Buttons and elements
Parameters/elements in the "Performance Monitoring" window
The following parameters and elements are available for editing:
|
Parameter/element |
Function |
|---|---|
|
Drop-down lists |
|
|
Asset List |
Clicking on the small arrow opens the drop-down list for selecting the machine. |
|
Buttons |
|
 |
Clicking on the "Screenshot" button generates a screenshot of the current window. |
 |
You update the opened window by clicking on the "Refresh" button. |
 |
Clicking on the "Machine" button opens the "Machine Details" window for the corresponding machine. |
|
Time buttons |
|
 |
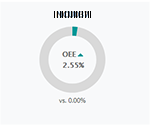
Clicking on "Today", in window "Machine Details" you can see the OEE and KPI values for the current day, taking into account the time of day. |
 |
Clicking on "Current week", you can see the OEE and KPI values for the current week. Starts on Monday and ends on the current workday. |
 |
Clicking on "Current month", you can see the OEE and KPI values for the current month. Starts on the 1st day of the month and ends on the current workday. |
 |
Clicking on "Current quarter", you can see the OEE and KPI values for the current quarter. Starts on the 1st day of the current quarter and ends on the current workday. |
 |
Clicking on "Current year", you can see the OEE and KPI values for the current year. Starts on January 1 and ends on the current workday. |
 |
Clicking on "Custom Date", you open a window to select a range of dates (time interval). After selection, this time interval
is displayed on the button. |