Results
Configuring reports
Description
A report is configured either for a planned periodical or a one-off generation.
The configuration for a report is saved.
You define the following for a report:
-
Report interval: One-off or planned
-
KPIs and variables that are reported
-
Type of aggregation: Balance value or process values
-
Placement of the values in a sheet of an Excel file
-
Recipients of the report
A report consists of one or multiple areas. For example, the values of a year can be shown in one area, while the daily values of the last month are shown in an additional area.
Procedure
To configure a report, follow these steps:
-
Open the "Reports" of the asset.
If a configuration has already been created, the overview is displayed.
-
Select "Create new report configuration".
-
The "Create report configuration" editor opens.
-
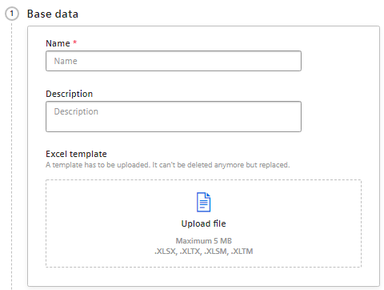
Enter the name of the report.
The name is shown as the subject in the sent email and in the overview of all reports.
-
Enter a description for the report.
The description makes it easier to assign the report.
-
Upload an Excel file as report template.
The template can be an empty file. The template can, for example, already be structured as filled cells that are pre-formatted by headlines. The template can, for example, contain a letter head or recurring information on the location of the plant for each report.
If you do not upload a template, a blank Excel file is used as the basis for the report. When editing the configuration for a regularly generated report again, you see a note that an automatically generated Excel file is being used. You can replace the automatically generated template with your own template.
-
Select the "Report interval".
-
Select the date on which you want the report generation to start.
The report is generated for the first time when the interval after the start date is reached.
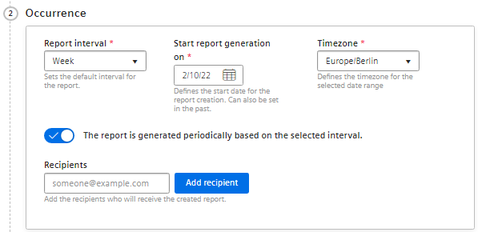
Example: The start date is 1/1/22. The interval is one week. The report is generated on 1/7/22.
-
Select a time zone.
The time zone is added as an offset to the start date.
-
To create a configuration for a report that is generated regularly based on the selected interval, activate the switch.

To generate a one-off report, deactivate the switch.
 One-off reports
NOTE
The configuration for one-off reports is not saved.
One-off reports are not sent via email.
-
To automatically send a report that is generated regularly based on an interval, enter a recipient.
-
Click "Add recipient".
-
Add additional recipients.
One-off reports are not sent.
-
-
Enter the name of the first section.
Creating sectionsNOTE
You can create up to 20 sections with different configurations. The sections can be exported in different sheets of the Excel workbook.
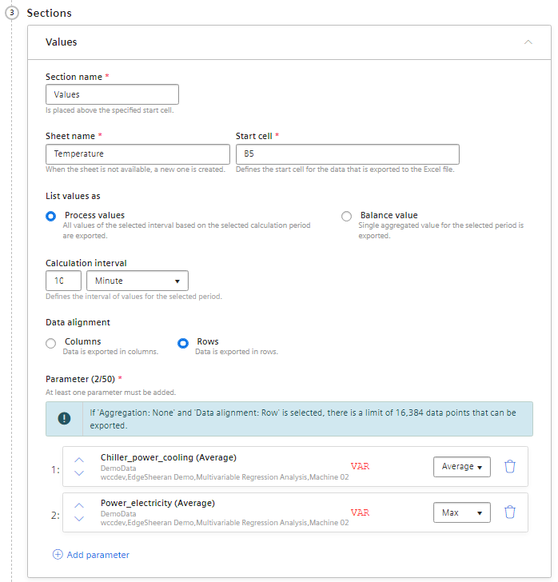
The name is specified together with the report interval in the start cell of the report. The values are listed below.
-
Specify the name of the Excel workbook sheet in which the section is exported.
If a sheet with that name does not exist in the template, it is created.
-
Enter the start cell as of which the values are exported.
No check of the cell sectionsNOTE
There is no check as to whether the exported values will overwrite existing content.
-
Select whether a balance value or process values are exported in this section.
-
Balance value: Single value that results from the aggregation of the interval values.
Example: The average value for one month.
-
Process values: All values that are available during the selected interval.
Example: A value is exported for each day of a month.
-
-
For process values only: Select the interval for the calculation.
Specifies how often a process value is output within the reporting period.
Example: For the reporting period of one month, values are output every hour.
-
For process values only: Select whether the display is in columns or rows.
-
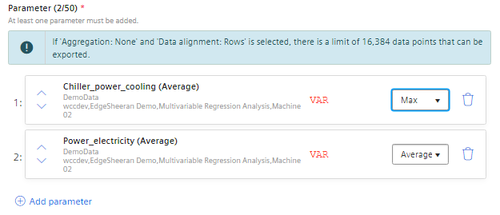
Select the parameters that are exported in the section.
 Parameter selection
NOTE
Maximum number per section: 50 parameters.
Parameters of the type String are not permitted.
-
To add a parameter to the report, select
 "Parameter".
-
Select the type of the parameter aggregation.
Too many process values through "None" aggregationNOTE
If "Aggregation: None" and "Data alignment: Rows" is selected, there is a limit of 16,384 data points that can be exported.
-
To change the order of the parameters, click on the arrows in front of the parameter name.
-
-
To create an additional section, select
"Add section".
-
To save the configuration, select "Save".
Result
-
The configuration for a report has been created and saved.
-
The "Overview of all reports" is displayed.
-
The report is generated as of the start date with the selected interval.
- or -
The report is generated once on the start date.
NOTE
An Excel file is required to create the report.
Permitted data formats XLSX, XLTX, XLSM and XLTM
Minimum file size: 1 KB
Maximum file size: 5 MB