Results
Editing charts
You can adapt the display of the charts using the display options and the chart settings. The functions are described below:
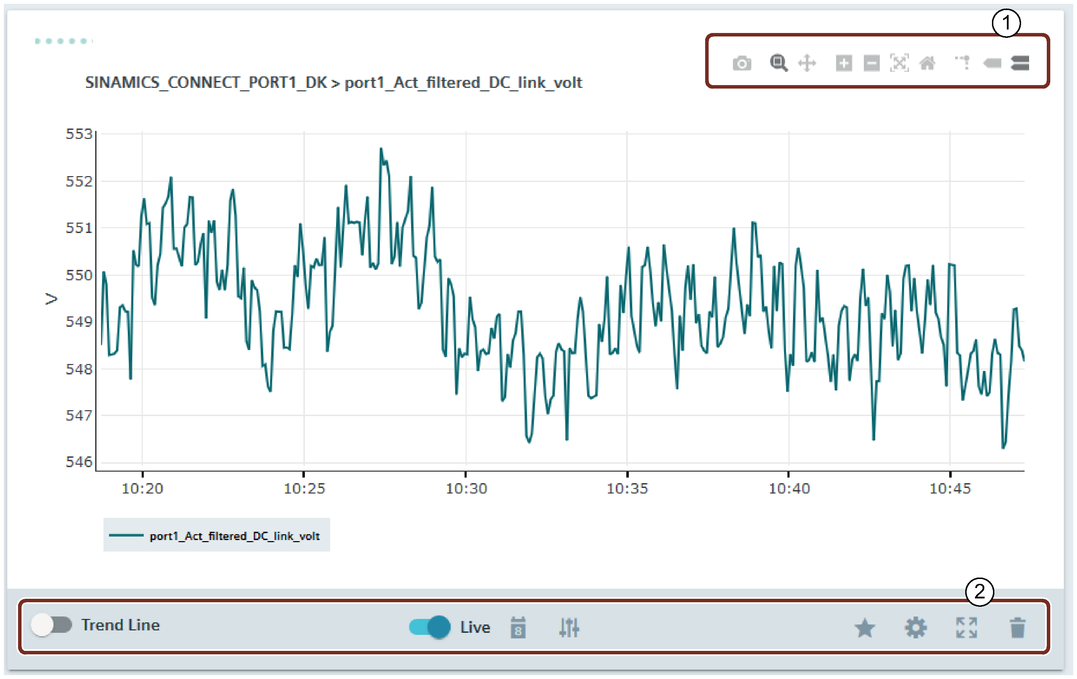
Display options ①
|
|
Saves the record as a png file in the "Downloads" folder on your PC. |
|
|
In this mode, you can mark a range in the chart using the mouse. The selected range is enlarged. |
|
|
In this mode, you can navigate forward and backward in the record. |
|
|
Zoom + |
|
|
Zoom - |
|
|
Automatic scaling of the data in the record. |
|
|
Reset the axes |
|
|
Display lines for a specific point in the diagram on the X and Y axes. 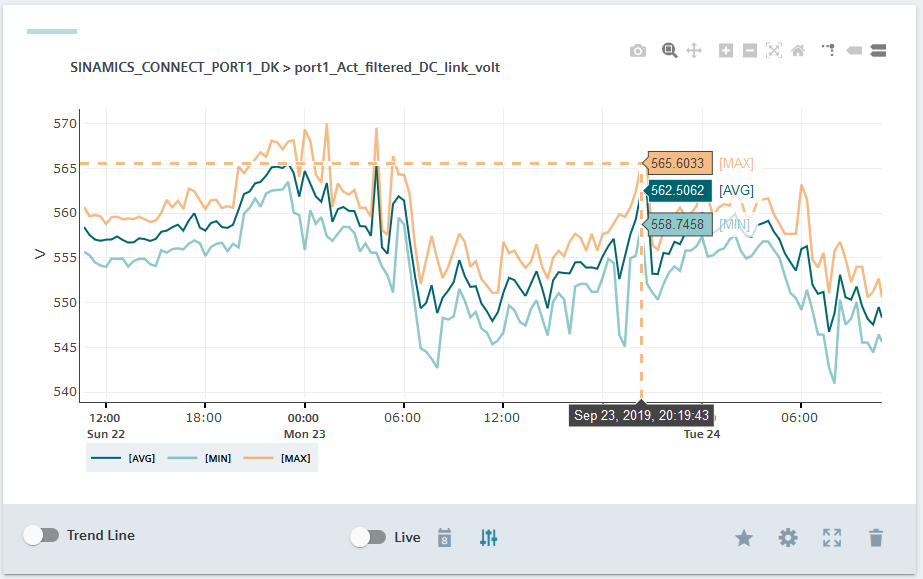 |
|
|
Shows the value of the nearest data point  |
|
|
Shows all data points 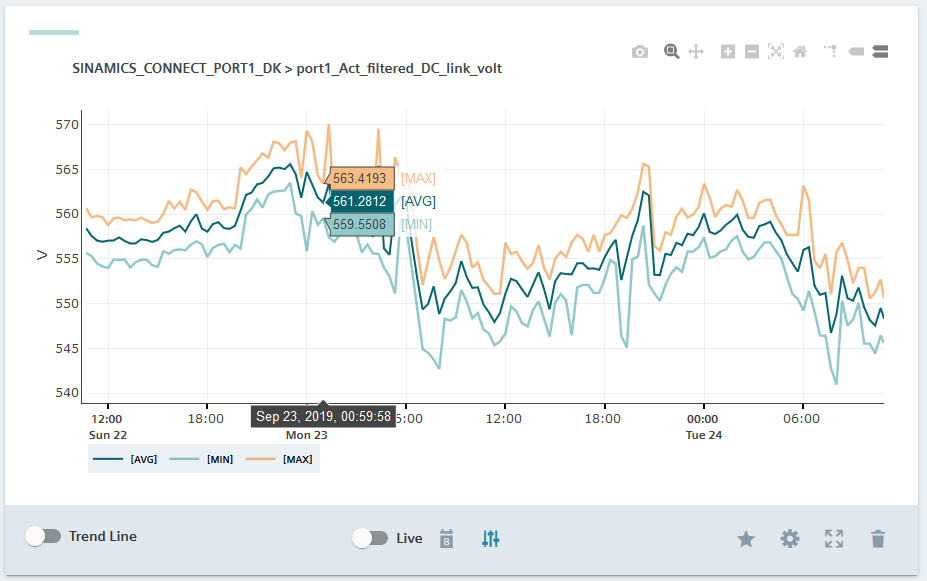 |


Chart settings ②
|
|
Show trend line 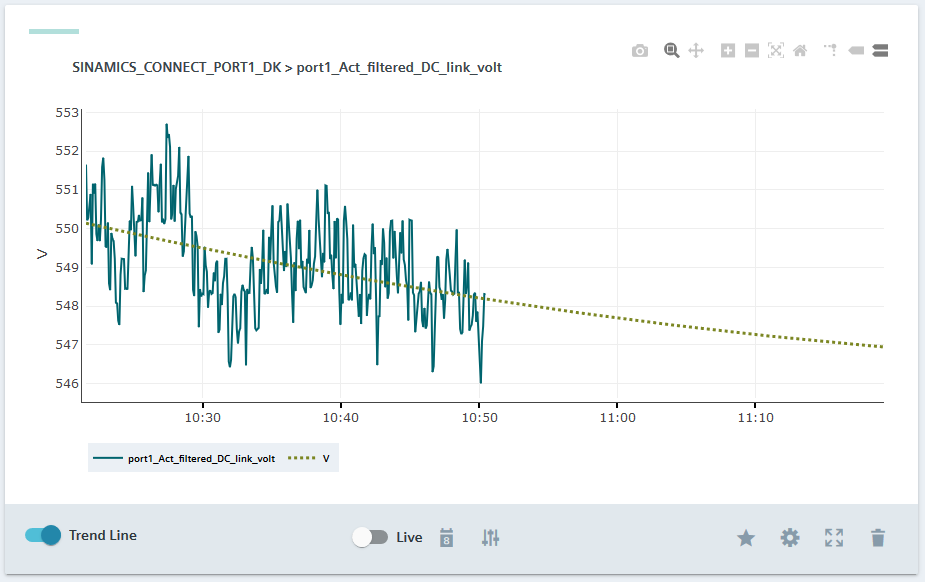 |
|
|
Activating/deactivating live data. The following icon is displayed for active live data. 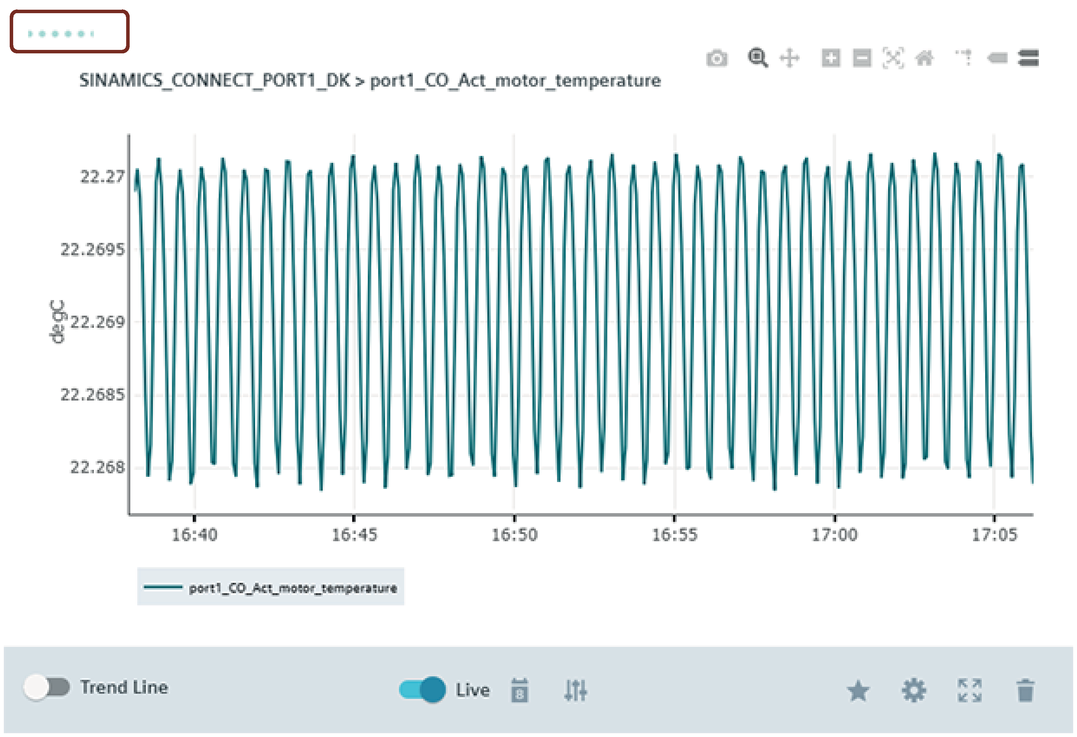 |
|
|
You can define a time range with date and time or select a defined time, e.g. "Yesterday". The maximum timeframe is 6 months. 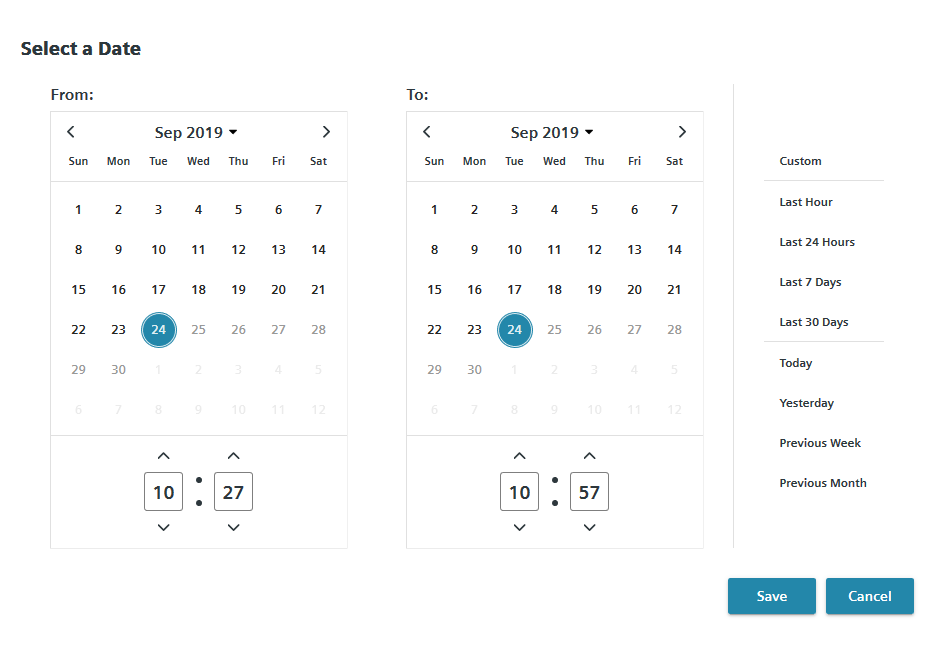 |
|
|
Show data statistics 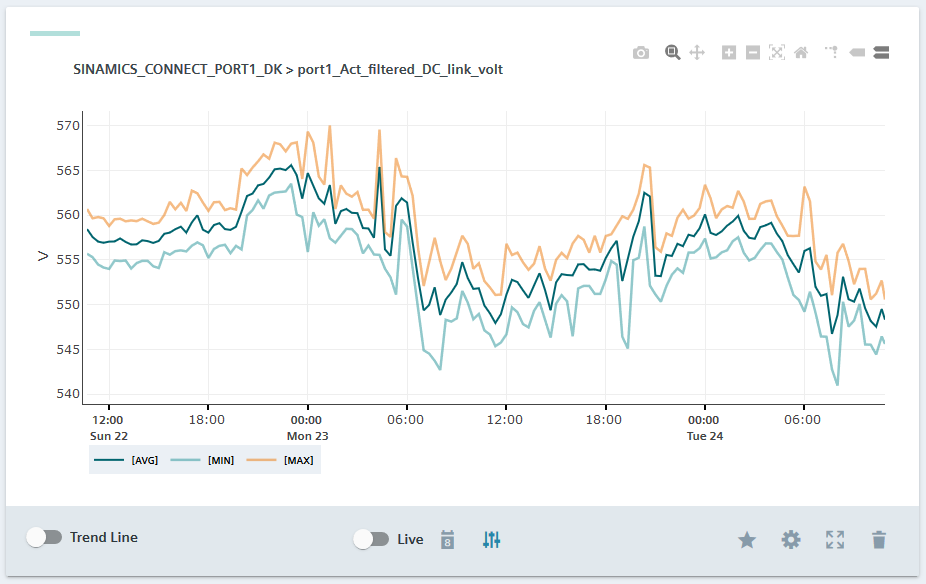 |
|
|
Save as favorite or delete from favorites |
|
|
Edit chart settings 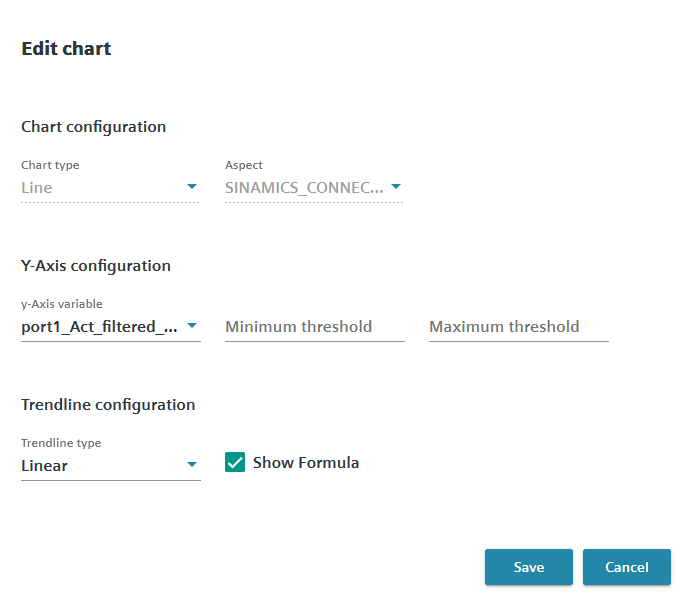 |
|
|
Full screen mode |
|
|
Delete chart |