Results
Creating chart - point cloud
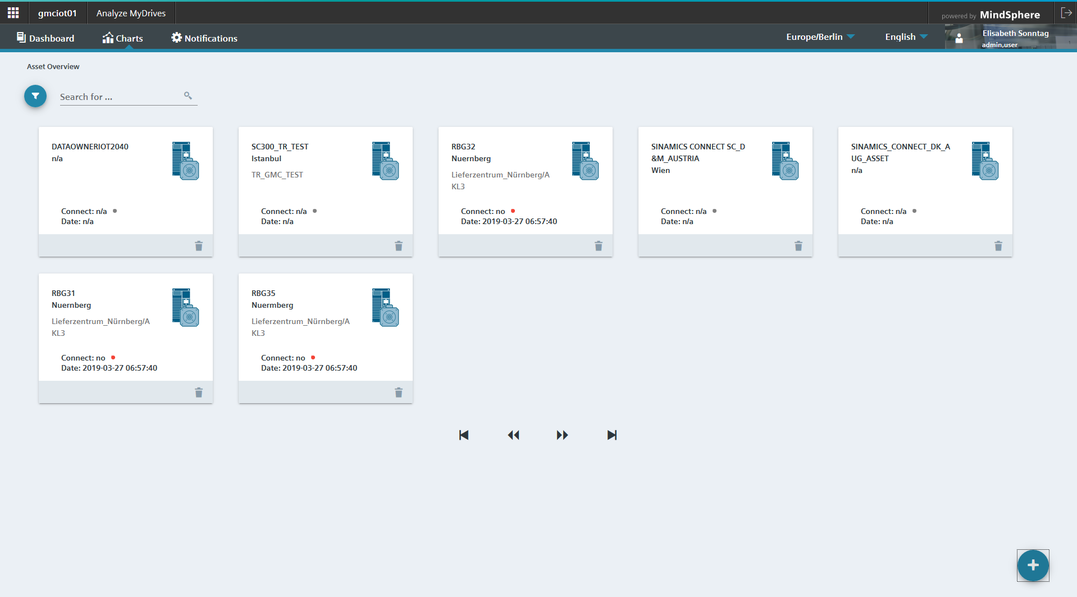
To create a chart of the "Point cloud" type, proceed as described below:
-
On the chart overview page, click the asset for which you want to create a chart.
-
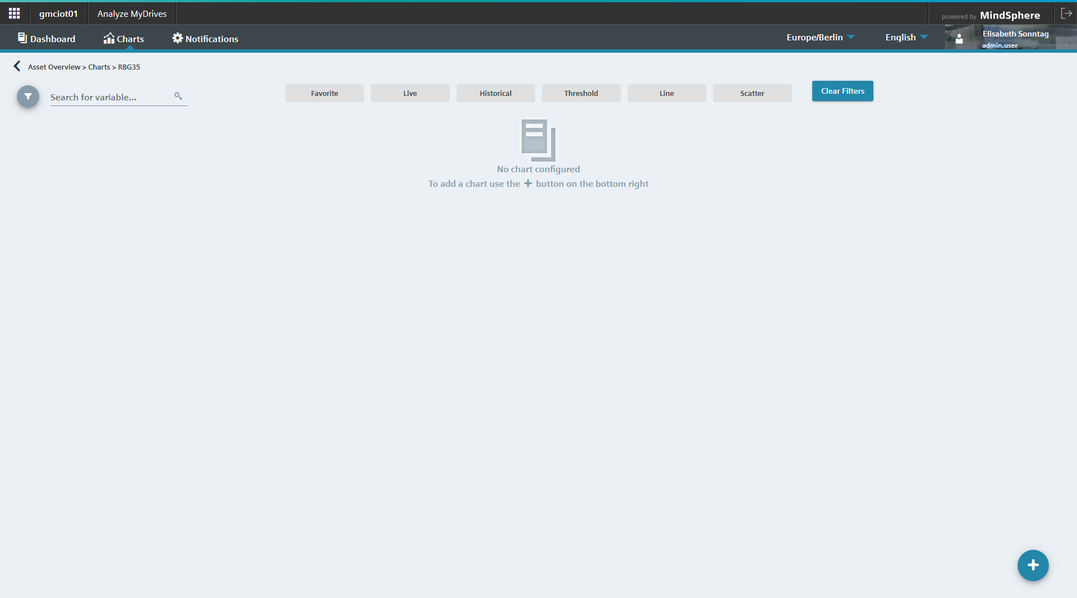
In the dialog box that then opens, click the
 button.
-
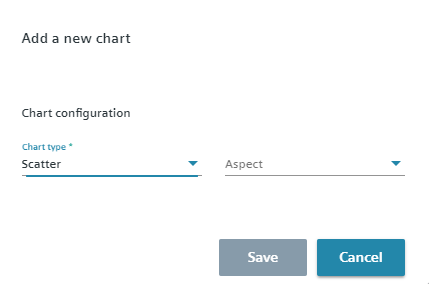
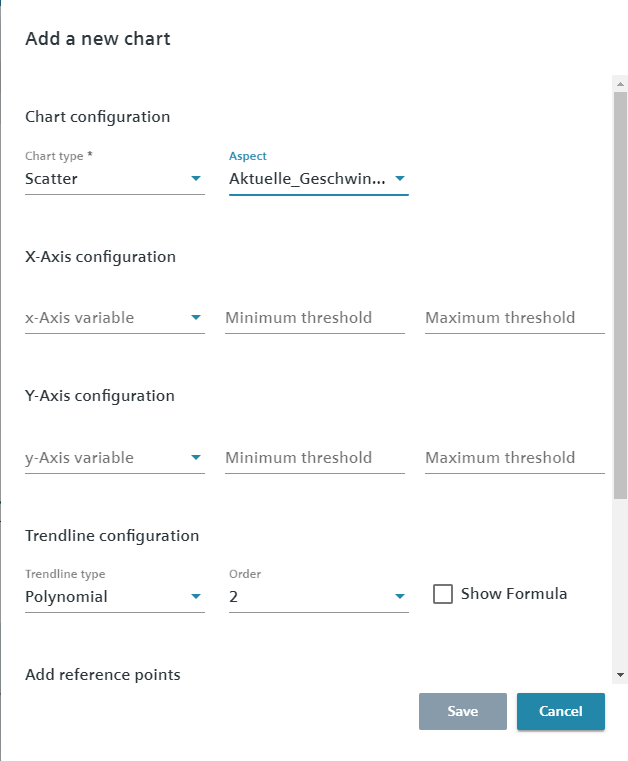
Select the chart type "Point cloud". With this chart type, you configure the X and Y axis.
-
Select an aspect. After making your selection, the following dialog is displayed.
-
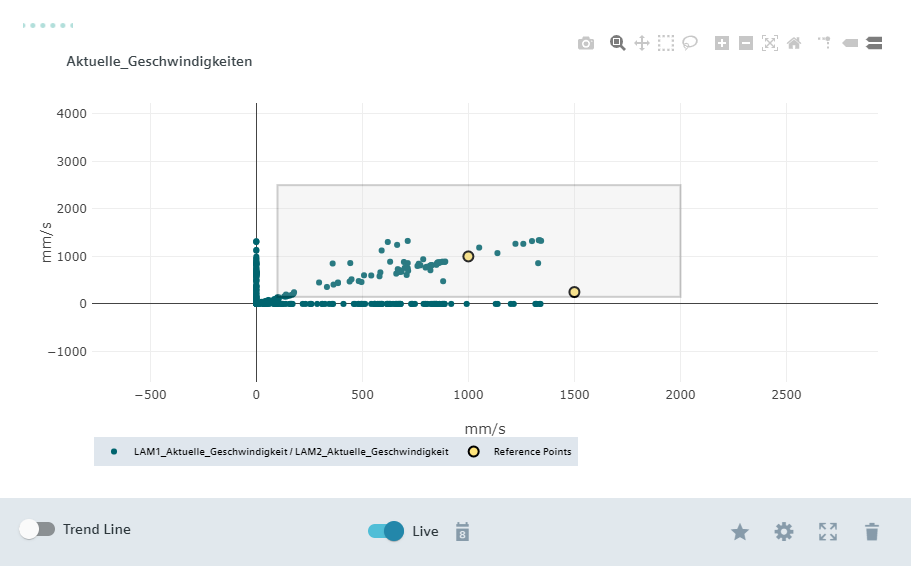
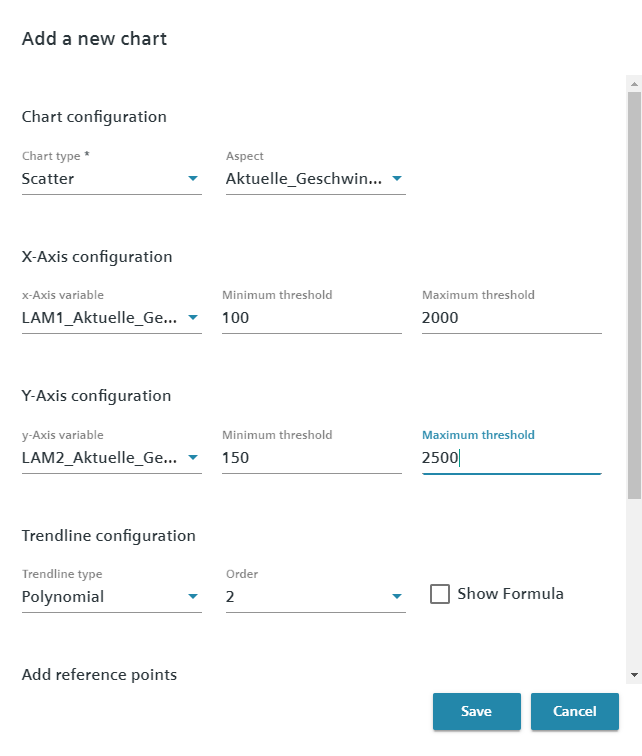
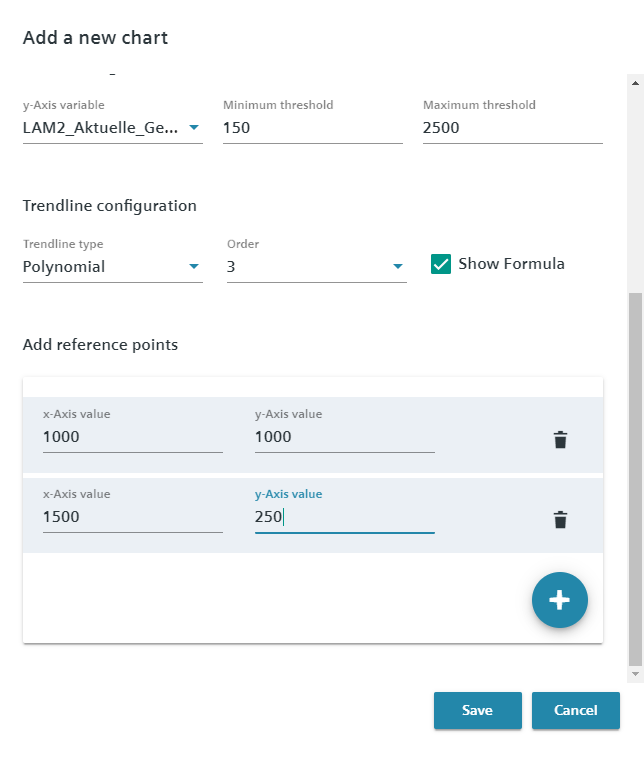
Assign variables to the X and Y axis. Determine the "minimum limit" and/or "maximum limit" for the respective variable, as required. Configure the trend line and activate "Display formula" as required. When you select "Show Formula", the trendline formula is displayed on the chart as a legend.
-
You can define reference points as necessary. Click
. Enter the X and Y value. Repeat this procedure to create further reference points.
-
Confirm your entries with "Save".
-
The chart is displayed. You can adapt the display options and change the chart settings .