Results
Creating a first flow
Overview
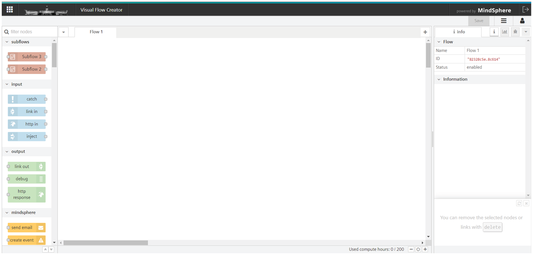
Visual Flow Creator is an application for visual data flow programming in IoT (Internet of Things). Nodes are predefined blocks of functionality. You can interlink and add nodes in the working area and combine them to produce a "Flow". This document introduces Visual Flow Creator editor and creates a flow that displays the Inject and Debug nodes.
Working with Editor
You can drag nodes from the palette and wire them to develop the flows in the working area. You can add the rows of tabs for the editor for the other flows.
Working with Node Palette
In the node palette, all nodes are available for creating the flow as per the requirement. From the palette drag and drop the nodes to the editor. You can search the node by typing the name in the filter node bar.
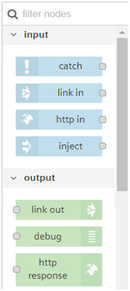
In the node palette, the following nodes are available:
-
Input nodes
-
Output nodes
-
MindSphere nodes
-
Function nodes
-
Analytics nodes
-
Storage nodes
-
Array nodes
-
Simple anomaly nodes
-
MindSphere dashboard nodes
-
Dashboard nodes
-
Data Lake and SDI nodes
-
Signal Validation nodes
-
Custom nodes
Working with Sidebar
The sidebar contains different tabs to view information and outputs of the flow from the editor.
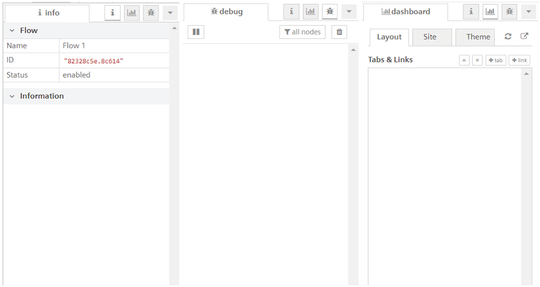
The tabs available in the sidebar:
Info tab: Node information will be displayed.
Debug tab: Output information will be displayed
Dashboard tab: Arrange and adjust the dashboard settings and display the dashboard output in the Visual Flow Creator dashboard.
Drag Inject node to Editor
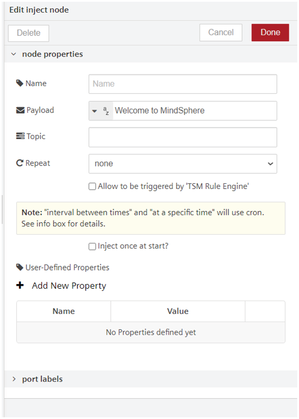
Inject nodes trigger data to the flow. Each inject node has one output. Use inject nodes to inject user defined data. They generate messages for downstream nodes.
Drag Debug node to Editor
Debug nodes send the data from the flow to the debug tab. Debug nodes have one input. Debug nodes can be configured to show whole message or just a payload.
Interconnect the nodes
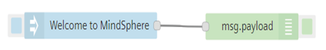
The nodes will be interconnected together by clicking the port and drag from the inject node to debug node port. This will interconnect the nodes to produce a flow. For example, edit the node properties by double clicking the inject node and input the string value as “Welcome to MindSphere” as shown below:
Processing input and output data
Visual Flow Creator nodes exchange the data by either receiving a message from the previous node in a flow or by getting the data from the external event, such as an incoming HTTP request, a timeseries data or display the event in the Visual Flow Creator dashboard. They process the message or event to transfer the data to the next nodes in the flow.
Save the flow
The nodes available in the editor are interconnected together and saved to produce a flow.
Result
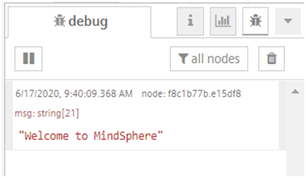
You have successfully created and executed your first flow in Visual Flow Creator. By clicking the inject node, the flow gets executed and generates output in the debug tab:
For more information about Visual Flow Creator, refer the below links: