Results
Report
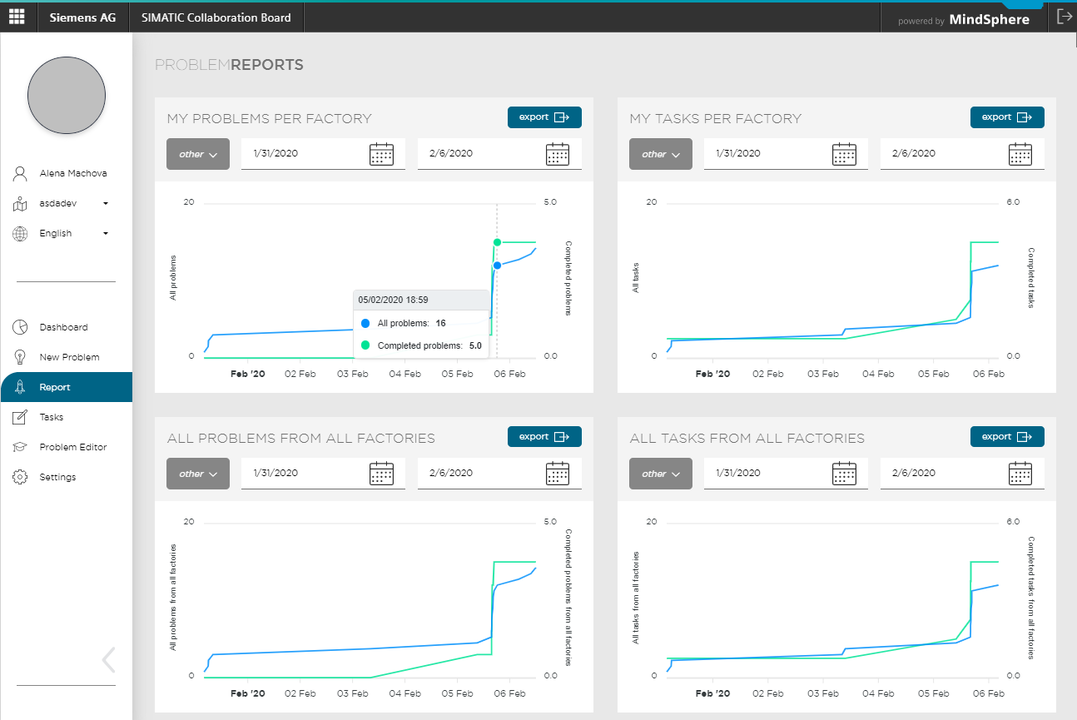
Creating a report
You will find a clear graphical representation of the problems described and solved in the "Report" tab.
The displayed graphics show:
-
Your problems in a factory
-
Your tasks in a factory
-
All problems from all factories
-
All tasks from all factories
You can adjust the range of the displayed interval depending on the selection in the drop-down list:
-
Last month
-
Last year
-
Last week
-
Last 24 hours
-
Today
-
Other (calendar selection)
In the diagram area, you can use the sliding ruler to directly read the values of problems and tasks.
Exporting data
You can export all data records for the specified period in XLS format.
The exported Excel workbook contains 4 separate worksheets for:
-
Problems
-
Tasks
-
Descriptions
-
Factory information
The data do not include the measures used.
You can obtain valuable analyses from the exported data.