Results
Dashboard
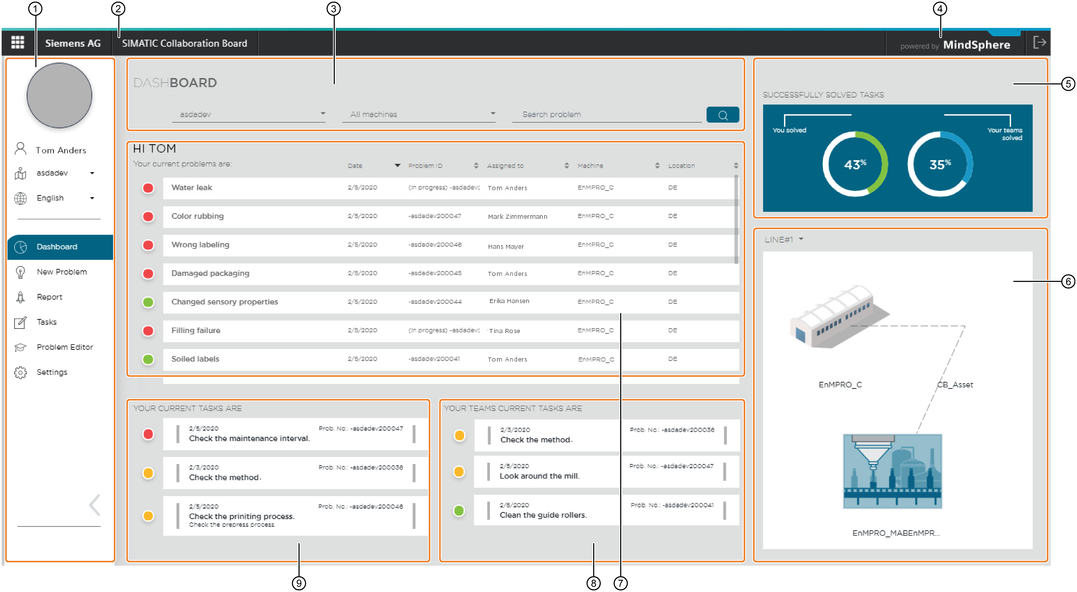
The "Dashboard" provides you with a list of available problem solutions. You can determine whether or not a similar problem has already occurred.
The following figure shows the individual areas:
|
① |
Side menu |
|
|
② |
Information on the app: Version, links to online help and OSS information |
|
|
③ |
Filter and search area |
|
|
④ |
Information on the MindSphere platform |
|
|
⑤ |
Presentation of the successfully completed problem solutions |
|
|
⑥ |
Display of the machines in a line |
|
|
⑦ |
Dashboard of all problem solutions |
|
|
⑧ |
Dashboard for team tasks |
|
|
⑨ |
Dashboard of my tasks |
① Side menu
Side menu is located in the left area of the application. Use the arrow key to expand or collapse it. You will find the following items:
User information
-
Picture of the user
-
User name
-
Location
-
Language switch
Menu items
|
Symbol |
Tab |
|---|---|
 |
Dashboard |
 |
New Problem |
 |
Report |
 |
Tasks |
 |
Problem Editor |
 |
Settings (only possible with administrator access) |
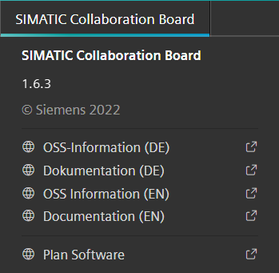
② Information on the app
Click on the name of the "SIMATIC Collaboration Board" application in the title bar to display the version of the application, copyright and links to the online help and OSS information.
③ Filter and search area
In this area, you have the following options:
-
Filter by factories/locations
-
Filter by machines
-
Search for a specific title of the problem solution
The search function is not case sensitive and searches through parts of the titles.
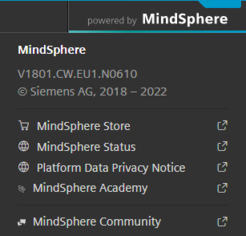
④ Information on the platform
Click on "powered by MindSphere" in the title bar to display the platform information.
⑤ Representation of successfully completed problem solutions
Graphical representation of the share of successfully completed problem solutions.
The diagram on the left shows the tasks you have solved. The right diagram shows the tasks that your team has solved.
⑥ Display of the individual elements in a line
The individual machines in a line are graphically displayed here using templates. The display can also provide information about the machine status if the machine connection is correct.
⑦ Overview of all problem solutions
List display of all existing problem solutions from you.
You will find the following information here:
-
Status
- Done (green)
- In progress (yellow)
- Undone (red) -
Title (short description)
-
Date (entry date)
-
Problem ID
-
Assigned to
-
Machine
-
Location
The list can be sorted by clicking on a column header.
⑧ Overview of team tasks
List view of the tasks assigned to the team of the logged-in user.