Results
Overview Dashboard
 Overview Dashboard: This dashboard provides information on energy consumption and device condition. It loads a cockpit view
of the entire system:
Overview Dashboard: This dashboard provides information on energy consumption and device condition. It loads a cockpit view
of the entire system:
-
Fleet Overview: This tab shows service providers and energy manager to view multiple locations.
-
Energy: This tab provides overview of energy consumption.
-
Peak Load: This tab gives overview of power consumption.
-
Device Condition: This tab provides information about device state.
Fleet Overview
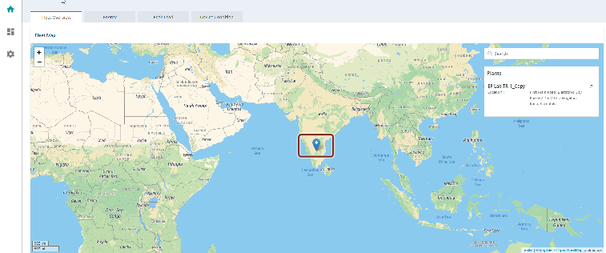
The location and overview of all the onboarded assets (furnished with location details) are shown under this tab in Fleet Map.
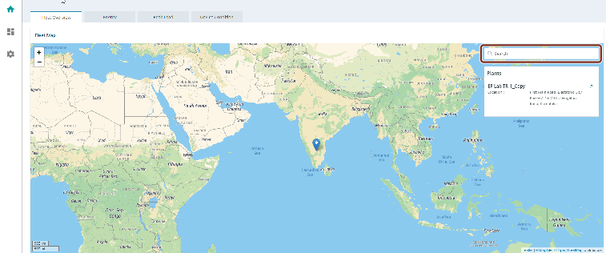
For assets not furnished with location details, follow the below steps:
-
Navigate to "Search" and click on the asset which is not displayed on the map.
-
Click on the arrow
 present on the right top corner of the selected asset.
-
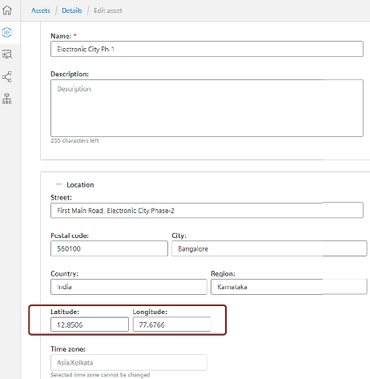
Click and expand the “Location”.
-
Provide the missing “Latitude” and “Longitude” values.
-
Click "Save".
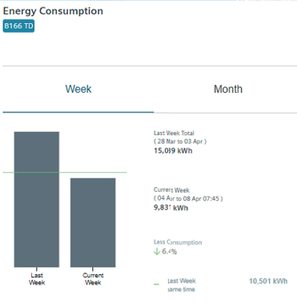
When hovered over an asset location on the fleet map, you can see the comparison of the energy consumption for week and month. User can click on the asset (example: Electronic City Ph-1 highlighted in blue) that directs to Energy tab. Green horizontal line is a threshold that shows the energy consumed on a specific day and time for the last week/month compared to what is being consumed for current week/month.
User can see if the energy consumed in current week/month is higher or lower compared to last week/month in the form of percentage. It also shows the energy consumed on Last week same time value.
Energy
Energy tab shows a Total per consumer, Sankey, Details per consumer, Benchmark, and Top10 consumer for the energy consumption of the selected period for all devices for SENTRON Powermind (tenant). You can select a time period as week, month, or year for all types of charts. You can navigate to earlier and next time period with navigation keys. Each device is assigned with unique color for easy interpretations.
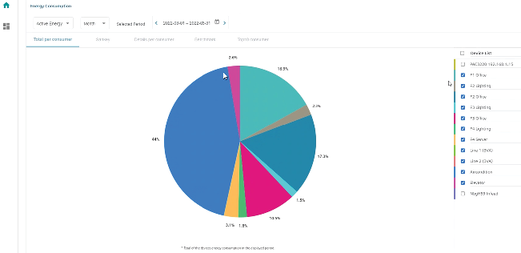
Total per consumer
The Total per consumer shows the following information:
-
Selected devices list.
-
Device differentiation by colors.
-
Percentage of devices energy consumption
The Total per consumer shows the information in the form of pie chart. PIe chart will show percentage of energy consumption for selected devices in selected time period.
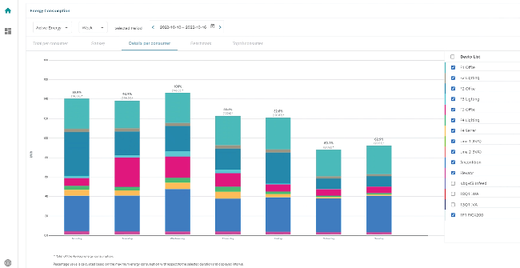
Details per consumer
The Details per consumer shows the following information:
-
Selectable device list and recalculated summarized energy values.
-
Device differentiation by colors.
-
Percentage of the day with highest consumption.
The Details per consumer shows the information in form of bar chart. The bar chart displays percentage of energy consumption for selected period of time.
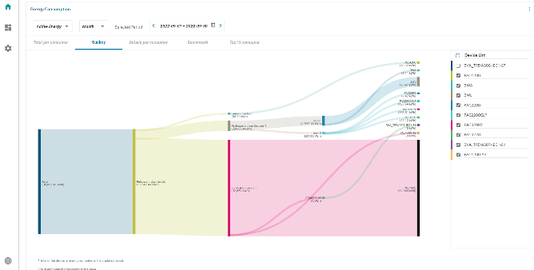
Sankey
The sankey shows the following information:
-
Selectable device list.
-
Energy flow within the entire system, from tenant level to device level.
-
Highlight on mouse hover for ease of use and readability.
-
Energy consumption information at each hierarchy level.
Sankey chart displays the energy consumption as flow diagram, where the size of the flow is proportionate to the energy consumption by the particular unit. The energy values of the devices selected in the device list are displayed in this tab. The left side unit represents the source and every consumption is represented in flow diagram towards right side. The below sankey diagram snap shot displays the energy consumption flow of one such plant.
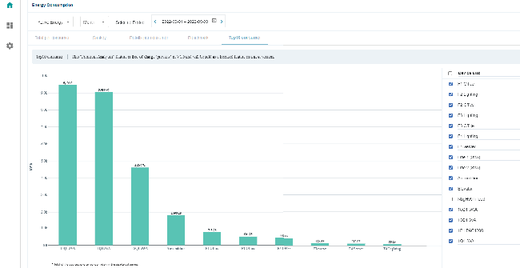
Top 10 Consumer
The Top 10 consumer shows the following information:
-
Selectable device list.
-
Total device energy consumption in selected time period.
The Top 10 consumer shows the information in format of bar chart. The bar chart displays total energy consumed by selected devices for selected period of time. If number of devices selected is more than 10 then this chart will show top 10 energy consuming devices.
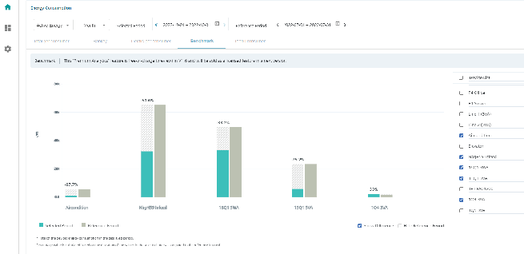
Benchmark
The Benchmark shows the following information:
-
Selectable device list.
-
Total device energy consumption in selected time period.
Benchmark shows the information in format of bar chart. In Benchmark tab, you can compare data between "Selected period" and "Reference period". You can select both periods individually. Selected and reference periods are shown in two different colors for easy identification. You can get the percentage difference of energy consumption in selected period to reference period by selecting checkbox "Show Difference". You can also hide reference period by selecting checkbox for "Hide Reference Period".
Peak Load
Peak Load tab shows power fluctuation for all SENTRON PAC meters for SENTRON Powermind (tenant). Select time period to view data of power fluctuation.
NOTE
Power consumption graphs are only available for SENTRON PAC devices.
Load Duration
The power consumption for selected period of time is displayed in the "Load Duration".
Load Duration can be visualized using below charts:
-
Load Duration Curve
-
Top 50 Values
-
Top 50 with timestamp
Load Duration Curve
Load Duration curve displays the power consumed values and the duration of each power consumed value used in the selected time period.
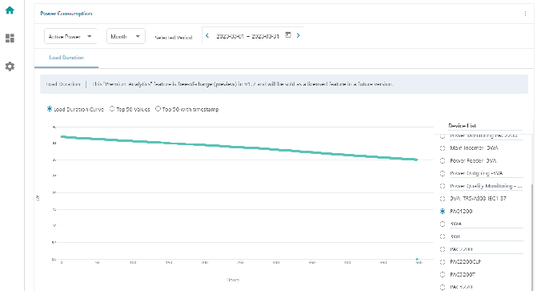
Load Duration Curve
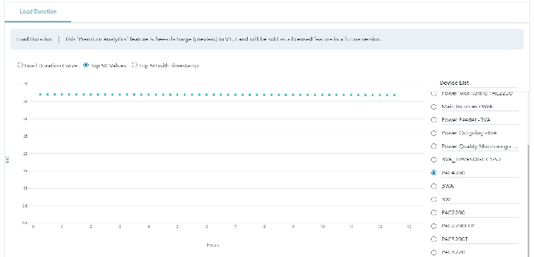
Top 50 Values
Top 50 Values shows the top 50 values of power fluctuation occured for selected time period.
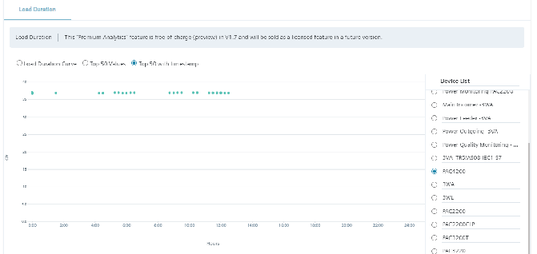
Top 50 with timestamp
Top 50 with timestamp shows at what time of day, top 50 power fluctuation occured for selected time period.
Device Condition
The health of the selected device is displayed in the "Health Indicator".
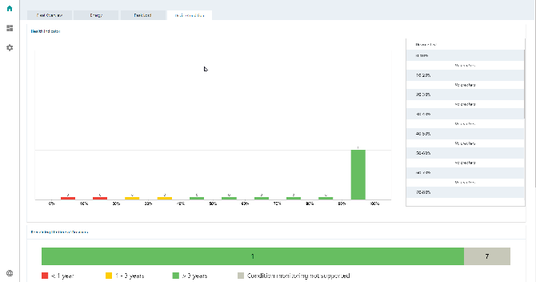
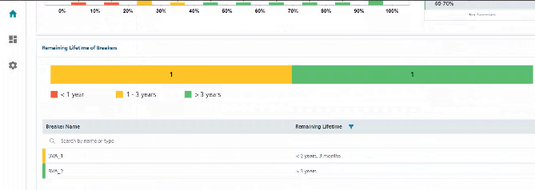
Details on lifetime of breakers/protection devices is displayed in the "Remaining Lifetime of Breakers".
NOTE
When you click on Dashboard, it expands to a list of data sources which can be further expanded to area sector or device level.