Results
Creating status mappings for the "Gantt" widget
Description
Using a status mapping, you represent changes of the variable value in the "Gantt" widget.
You can assign a color, a label, a description and a time category to a value (machine status).
Based on a time model, you can calculate how long the machine was in a specific time category or how often one of the assigned machine statuses was in a specific time category.
These calculations are the basis for determining the OEE KPI (Overall Equipment Effectiveness) and the TEEP KPI (Total Effective Equipment Performance).
You can find additional information about the productivity of a machine or plant here: Overview of the overall equipment effectiveness (OEE).
Status mappings
You create status mappings either when you create a Gantt widget or in the "Configuration" tab. The "Configuration" tab shows the status mappings that already exist.
Creating and editing a status mapping
To create a status mapping, follow these steps:
-
Open "Configuration" > "Status mappings".
-
Click on "New status mapping".
-
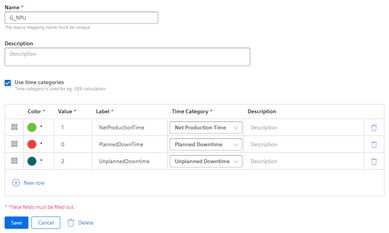
Assign a unique name and a description.
-
Select the "Use time categories" check box if you want to map the status mapping in connection with the calculation of the productivity of your plant (overall equipment effectiveness) to a KPI instance.
-
You can assign a color, a label, a time category and a description for each value that a variable can assume.
If a value that is not defined in the status mapping table occurs in the variable, it is displayed with the status "not defined" and the color white in the Gantt widget.
You use the created status mapping in connection with the "Gantt" widget. The order of each state mapping is reflected in
the Gantt widget in the same way as shown in the table. You can change the order by dragging the  icon.
icon.