Results
- MindSphere app SIMATIC Performance Insight V1.15
- Legal information
- What's new in Performance Insight?
- Introduction to Performance Insight
- Configuring types
- Setting parameters
- Parameters in Performance Insight
- Displaying a parameter list
- Displaying current values of a parameter
- Editing settings for variables
- Editing settings for KPI instances
- Saving the values of a KPI in a variable
- "Activate notifications" for variables with numerical data type and KPI instances
- "Activate notifications" for variables of the data type "Bool" and "String"
- "Counter" acquisition category
- Aggregation functions
- Presenting the productivity of a plant transparently (OEE analysis)
- Configuring a step time analysis
- Configuring multivariable regression
- Evaluating the production of individual batches
- Creating user-defined dashboards
- Creating a dashboard
- Structure of the dashboards
- Creating widgets
- Introduction to widgets
- Create a widget
- Visualizing correlations (Diagram)
- Visualizing values (Value)
- Visualizing machine statuses (Gantt)
- Visualizing the violation of limit values (gauge)
- Visualizing the distribution of consumptions or quantities (Pie chart)
- Visualizing the intensity of data values (Heatmap)
- Visualizing relationships in 3D (3D bars)
- Preview a widget
- Working with widgets
- Widget views
- Adapting a user-defined dashboard
- Exporting and importing dashboards
- Analyzing data
- Creating reports
- Appendix
Application examples
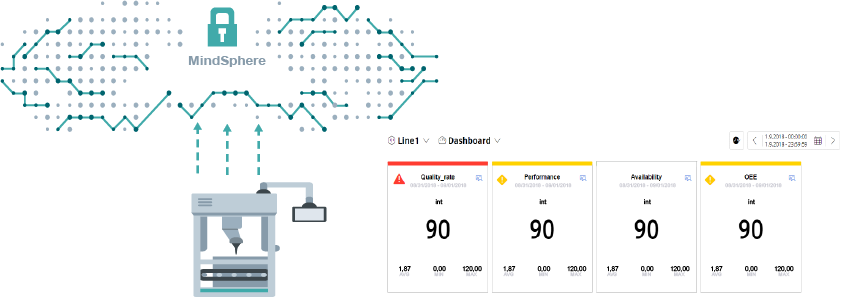
Application example visualization
From the plant, you transfer data such as quality rate, power and availability to MindSphere. You visualize the data in Performance Insight with the help of widgets.
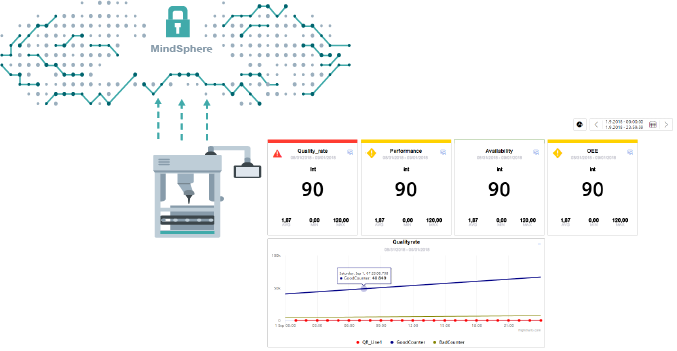
Application example KPI calculation
Raw data, such as production numbers, machine runtimes and water consumption, are transferred from production to MindSphere.
You use the transferred raw data to calculate and visualize indicators for your plant performance with the app.
Application example with CMS characteristic values
You can find a detailed application example with CMS characteristic values in the Siemens Industry Online Support here: Observe and visualize CMS characteristic values in the Performance Insight App.
Chap. 3.5