Local Diagnostic Dashboard Application
Local Diagnostic Dashboard Application packs useful information about Sinumerik Edge. Main functionalities are:
-
System information
-
App management
-
Network configuration
Using Application
Local Diagnostic Dashboard Application comes with firmware version >=2.1. In order to reach to the application, SINUMERIK Edge must have access to the internet. You can reach Diagostic Application with the address http://<device_ip> or https://<device_ip> on a web browser. You can login with "Administrator" or the "Diag" user which is a predefined user for diagnostic purpose, the default password can be acquired as explained here.
When you login succesfully, you will need to create your new password. Once you created your new password, you will be directed to main page of ReverseProxy. You need to replace the URL with Local Diagnostic Dashboard Application's adress.
Warning
It should be noted that users should avoid opening multiple sessions into Diagnostic Dashboard Application for a better performance. Only one client session is supported.
System Information
In this section, useful information for SINUMERIK Edge can be found. Also system and Exeni logs can be downloaded. The onboarding status and downloading the onboarding related logs are available.
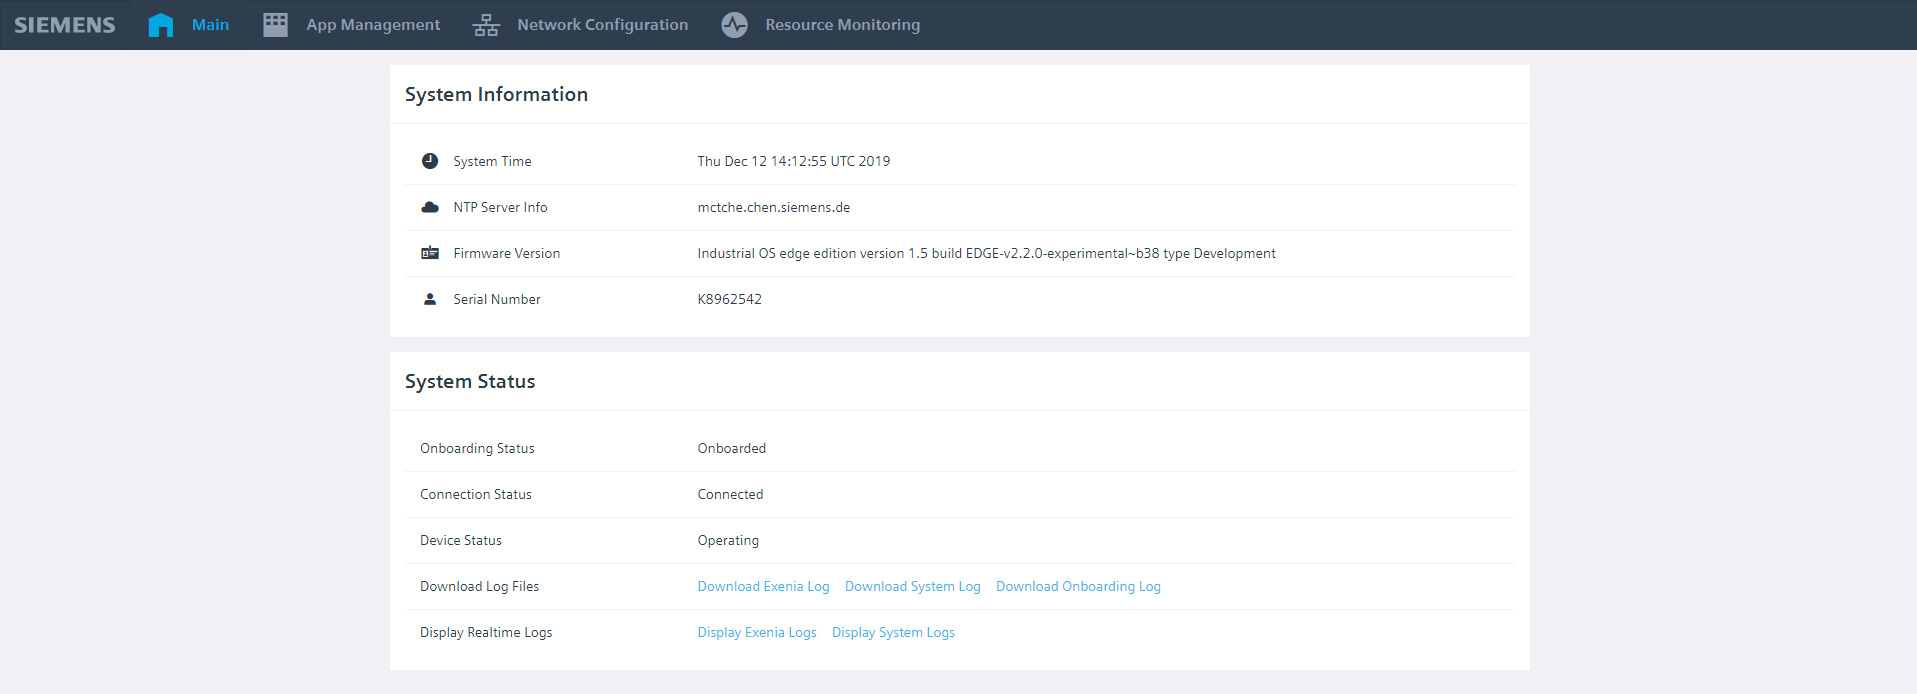
System Time
Displays current time of your SINUMERIK Edge.
NTP Server Information
If configured during onboarding, displays NTP server currently used on SINUMERIK Edge.
Firmware Version
Displays current firmware version installed on SINUMERIK Edge.
Onboarding Status
Displays onboarding status.
Connection Status
Displays internet connection of SINUMERIK Edge.
Device Status
Displays task which is being handled by device. "Operating" means SINUMERIK Edge does not have any application installation or reconfiguration job in progress. The status changes with the transactions made on Insights Hub.
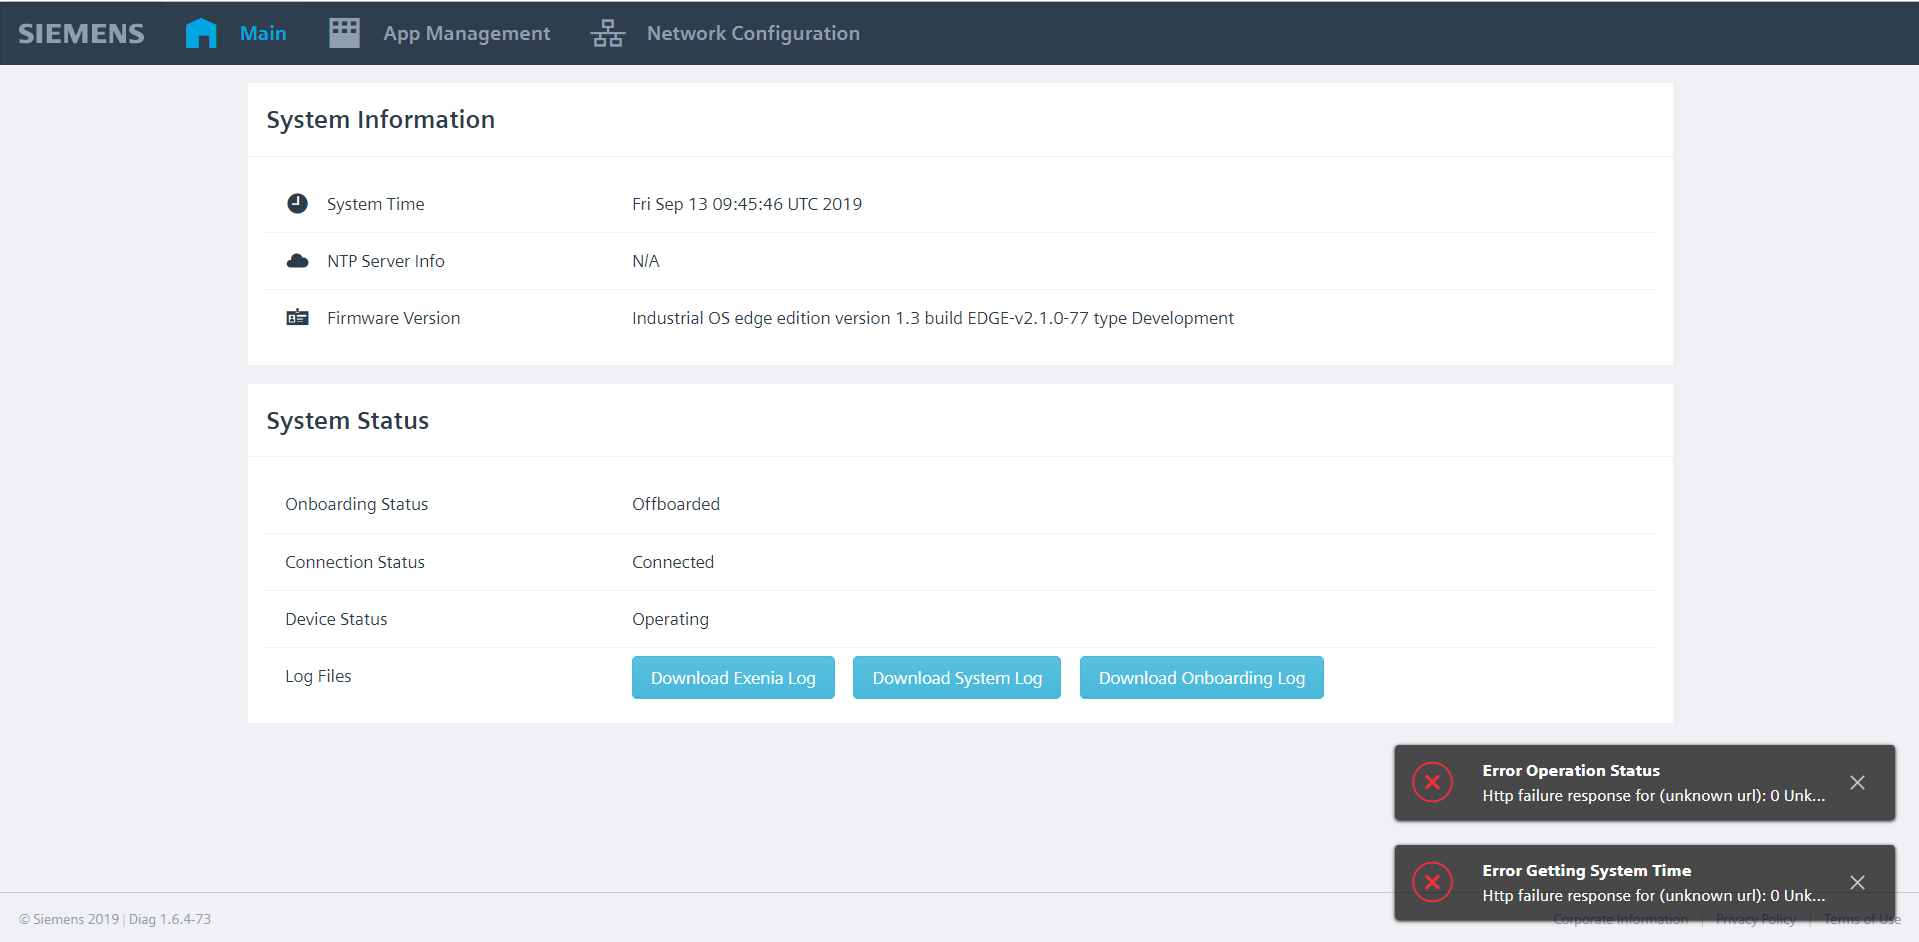
Attention: When an application installation, configuration change or an onboarding process starts, ReverseProxy is being restarted. Since Disgnostic Application is reachable via ReverseProxy, Local Diagnostic Dashboard Application will not be able to check the status of SINUMERIK Edge and you will some error messages on the bottom right of your screen. You can find an example on the image below. On that case, SINUMERIK Edge is being onboarded. You need to wait approximately 45 seconds and refresh the web page. Then, you will need to login to ReverseProxy with "Administrator" as name and your new password which you created when you first logged in.
Log Files
It is possible to get system wide logs. Exenia and system log files are served separately. Timespan of these log files are limited with one hour.
Onboarding Logs
Downloading the logs and checking the progress of onboarding is also available. The button is available when the SINUMERIK Edge is not onboarded. If you onboarded your SINUMERIK Edge, the button will not be available. When the onboarding process starts, the button for downloading the onboarding related logs will be available again.
Realtime Application Logs
Realtime logs from SINUMERIK Edge can be observed by clicking display logs button.
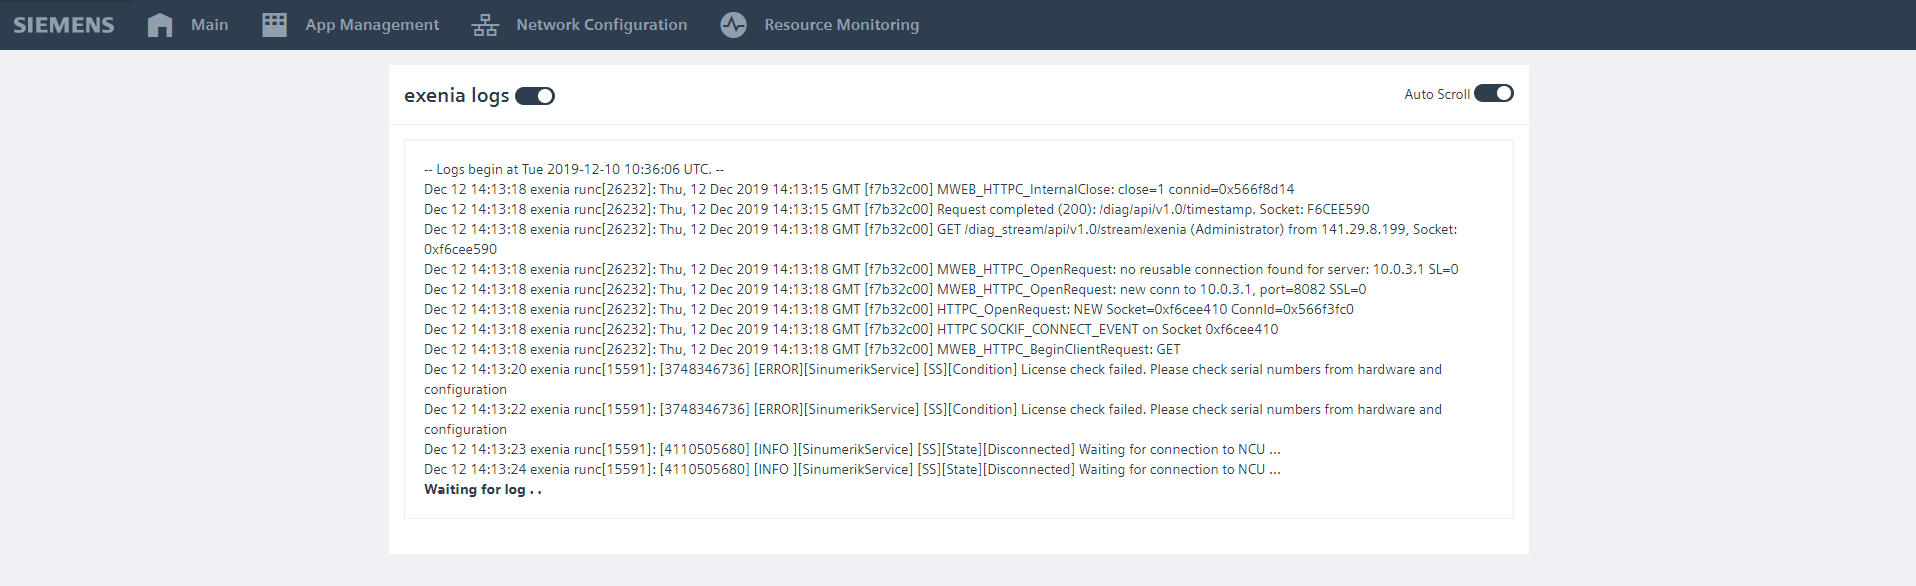
By using switch on the left user can stop or start the logs. However in this case logs are discarted until its activated again.
App Management
In App Management it is possible to inspect installed System and Edge Applications. You can reach to configuration of your application, reach to the UI of your application, check the status of them and download their logs.
Application Listing
Application details, version and status are displayed for each app.
Container Listing
Containers are listed under applications for both single and multi container applications. Below images are examples of applications installed to SINUMERIK Edge.
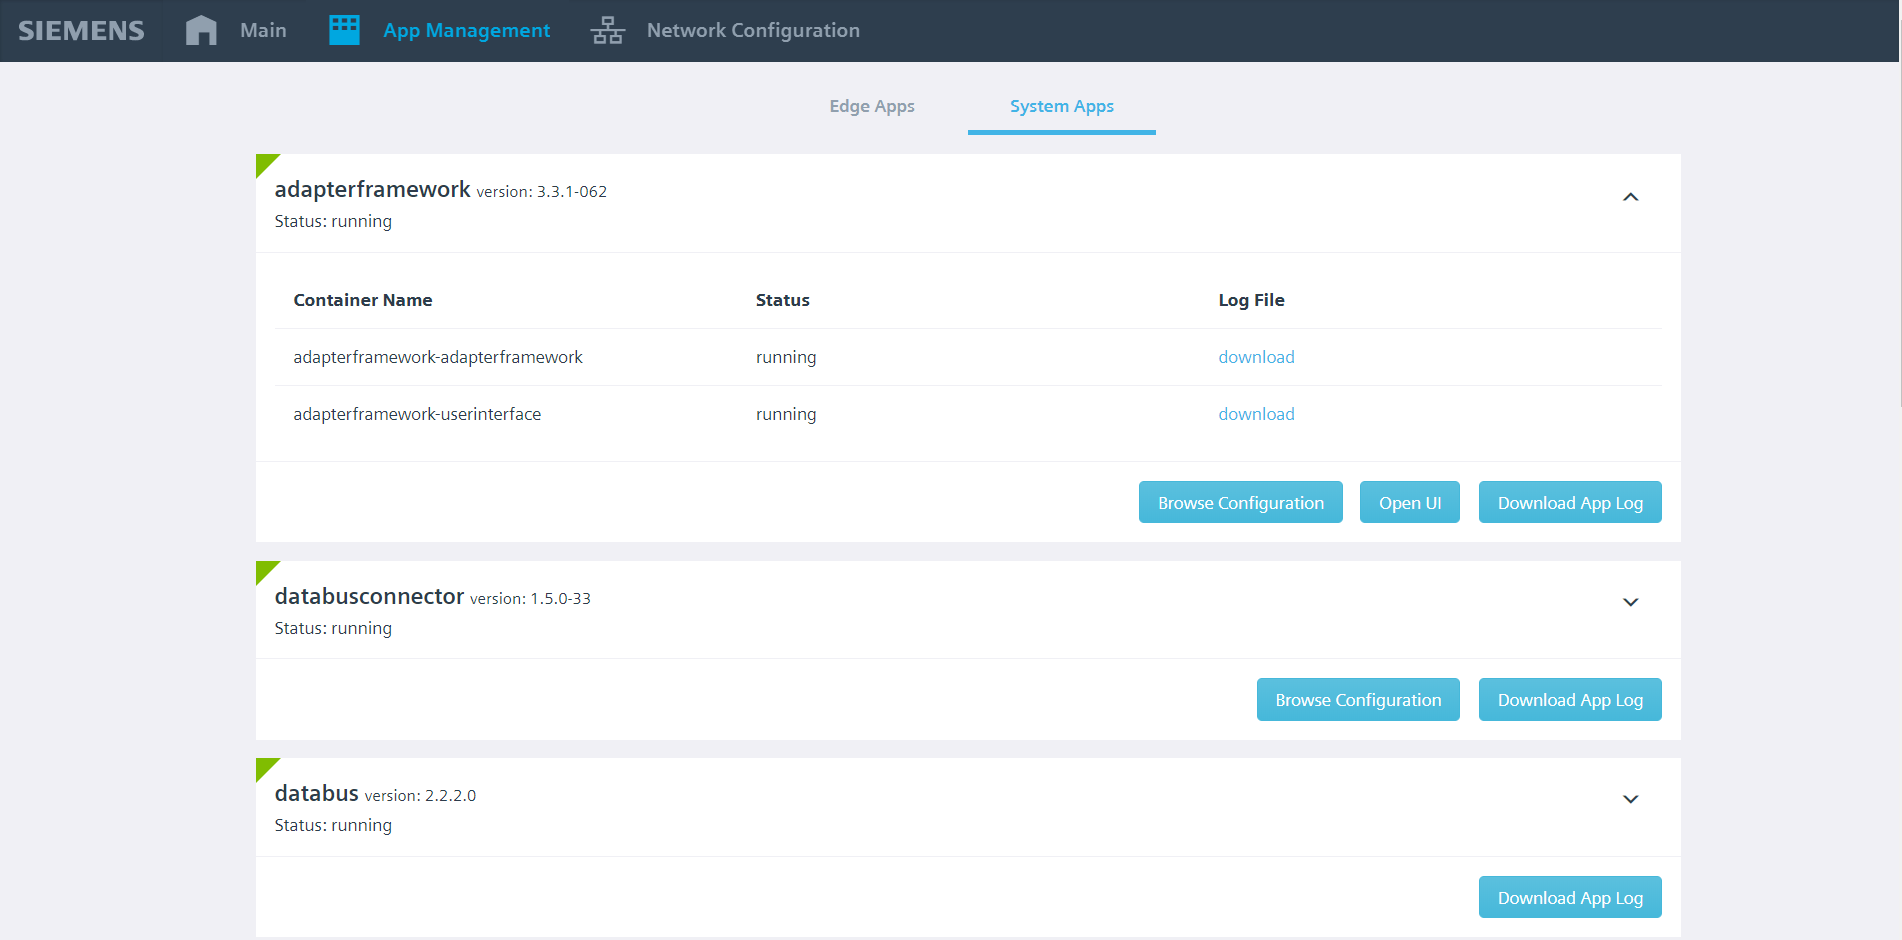
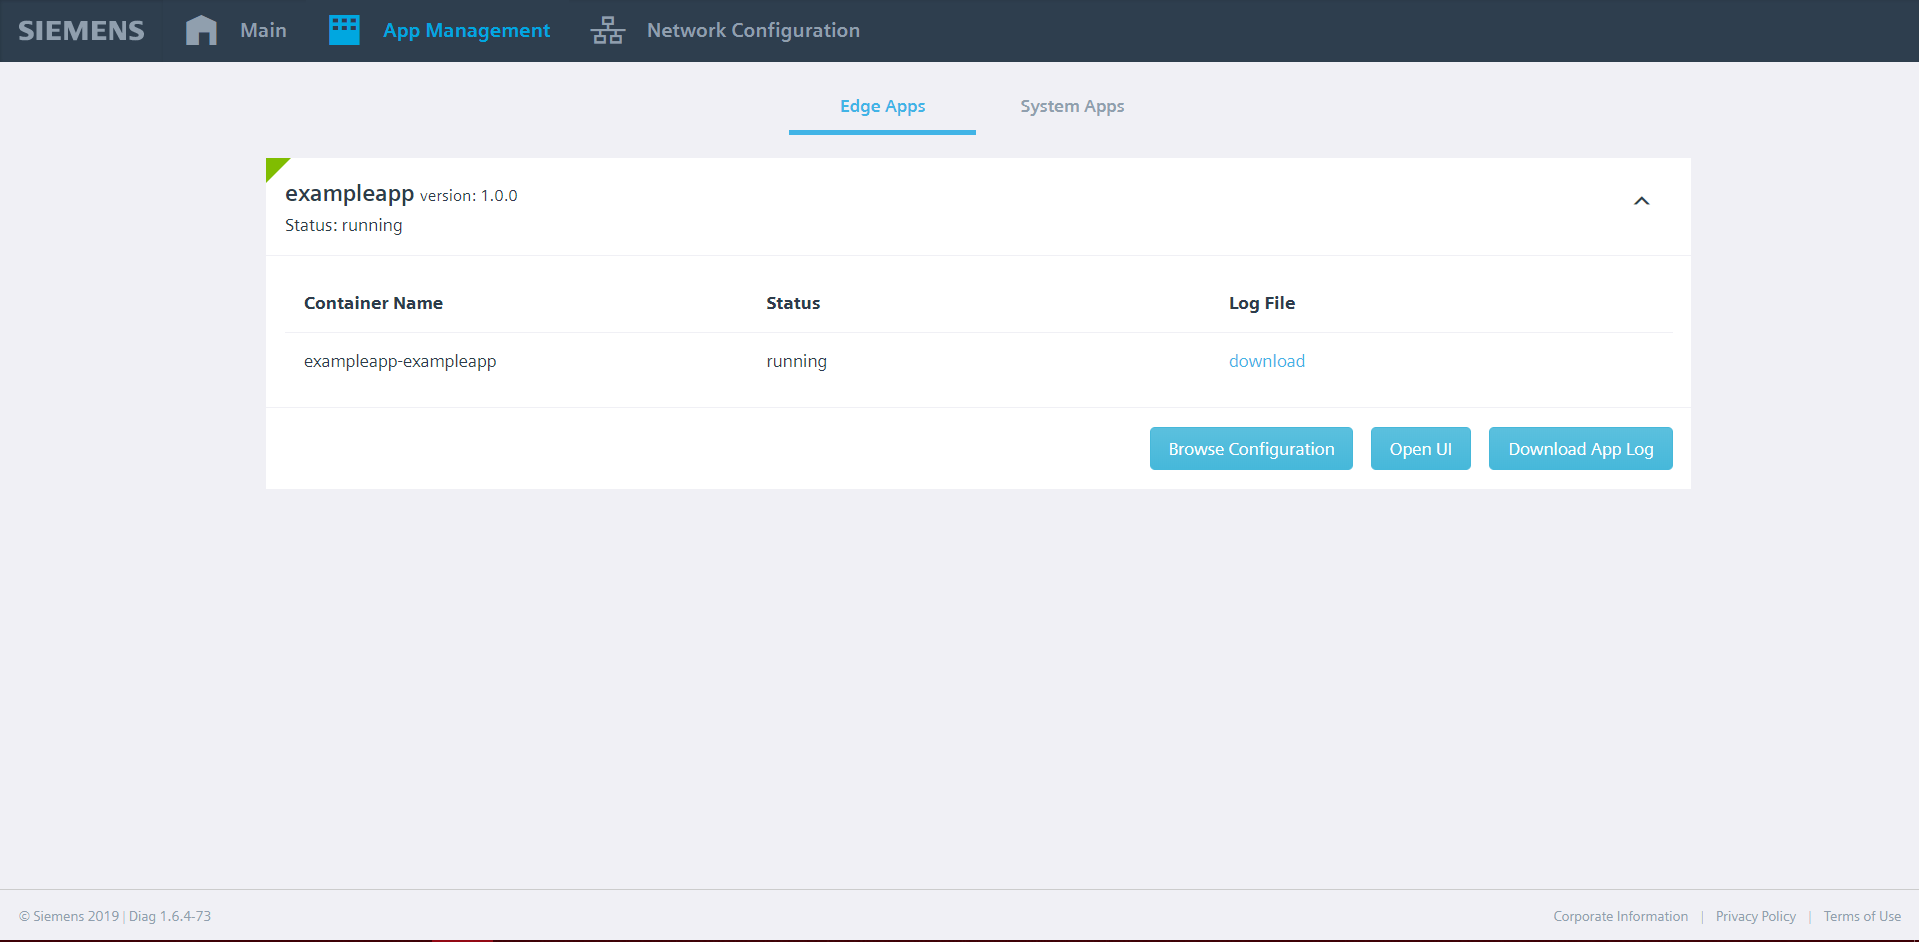
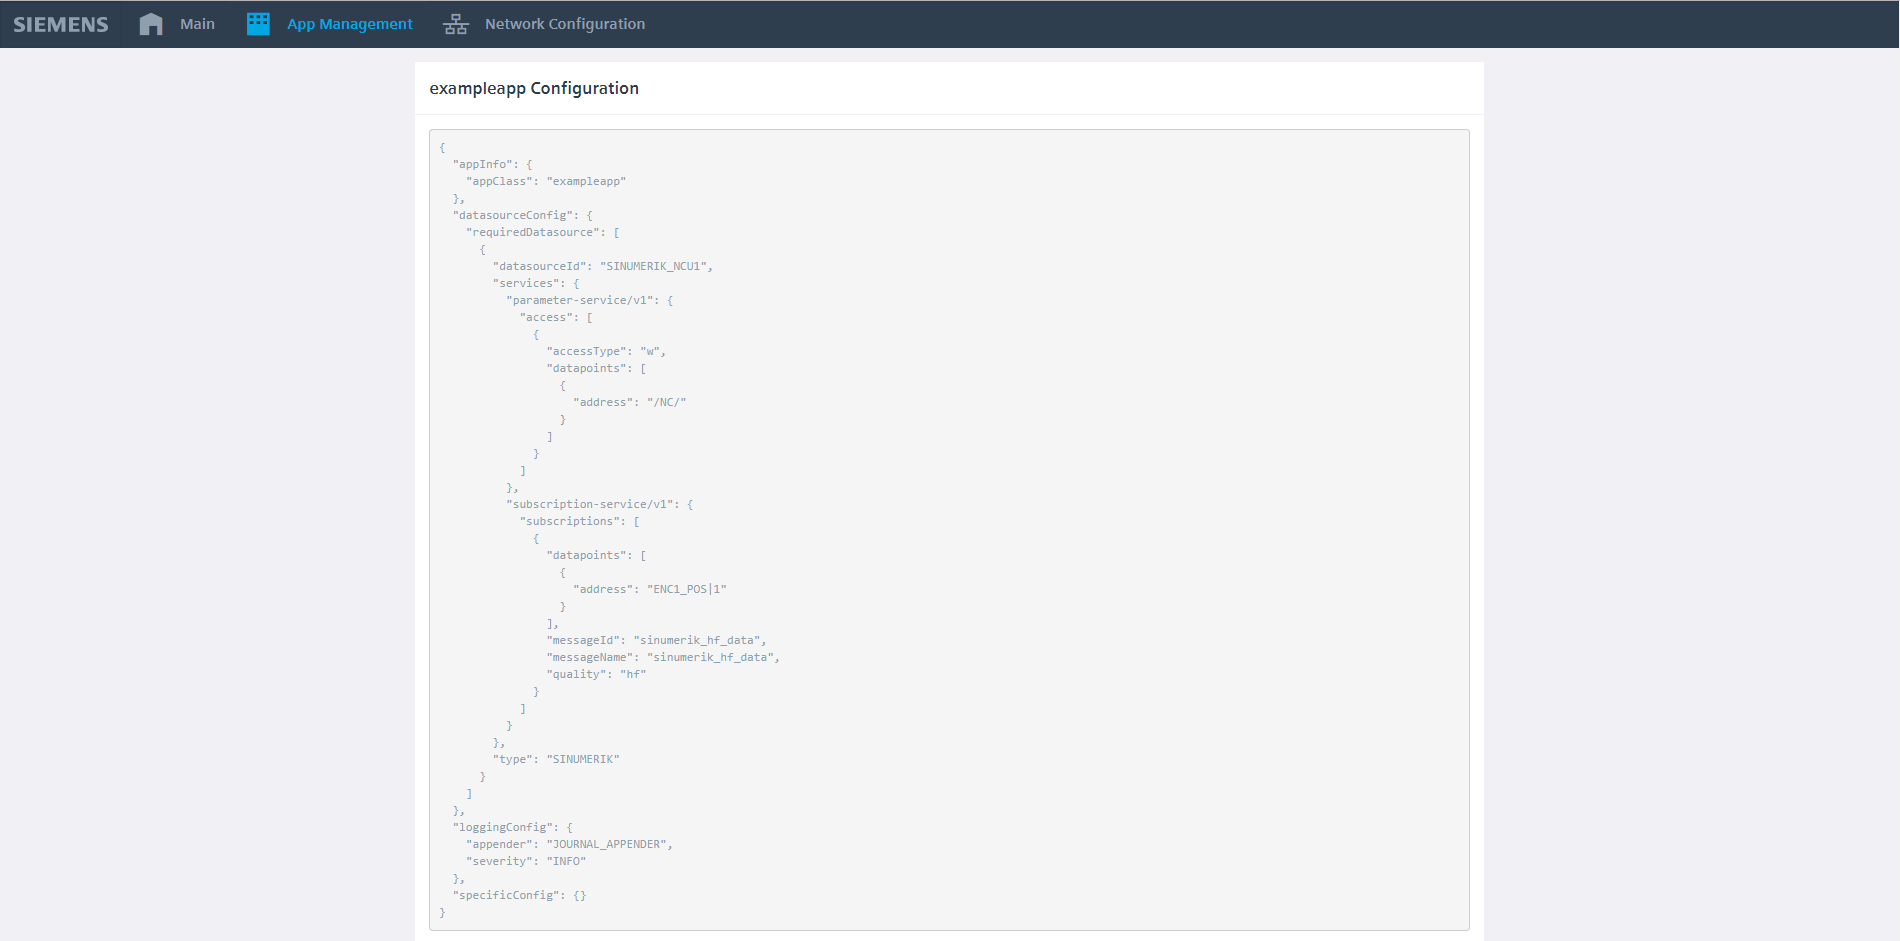
Application Configuration
Configuration of applications can be displayed by using browse configuration part on app listing.
Easy UI Access
If any of the installed applications has an UI served over ReverseProxy an easy to use open UI button appears on listing which leads to UI of specific application.
Application Logs
It is possible to download log files for a specific application. Like Exenia and system log files, these are also limited with last one hour.
Container Logs
Container-wise log files are also served within container listing. This feature give flexibility of getting log files of containers seperately.
Realtime Logs
It is possible to display realtime logs for both applications and application container by clicking display logs button.
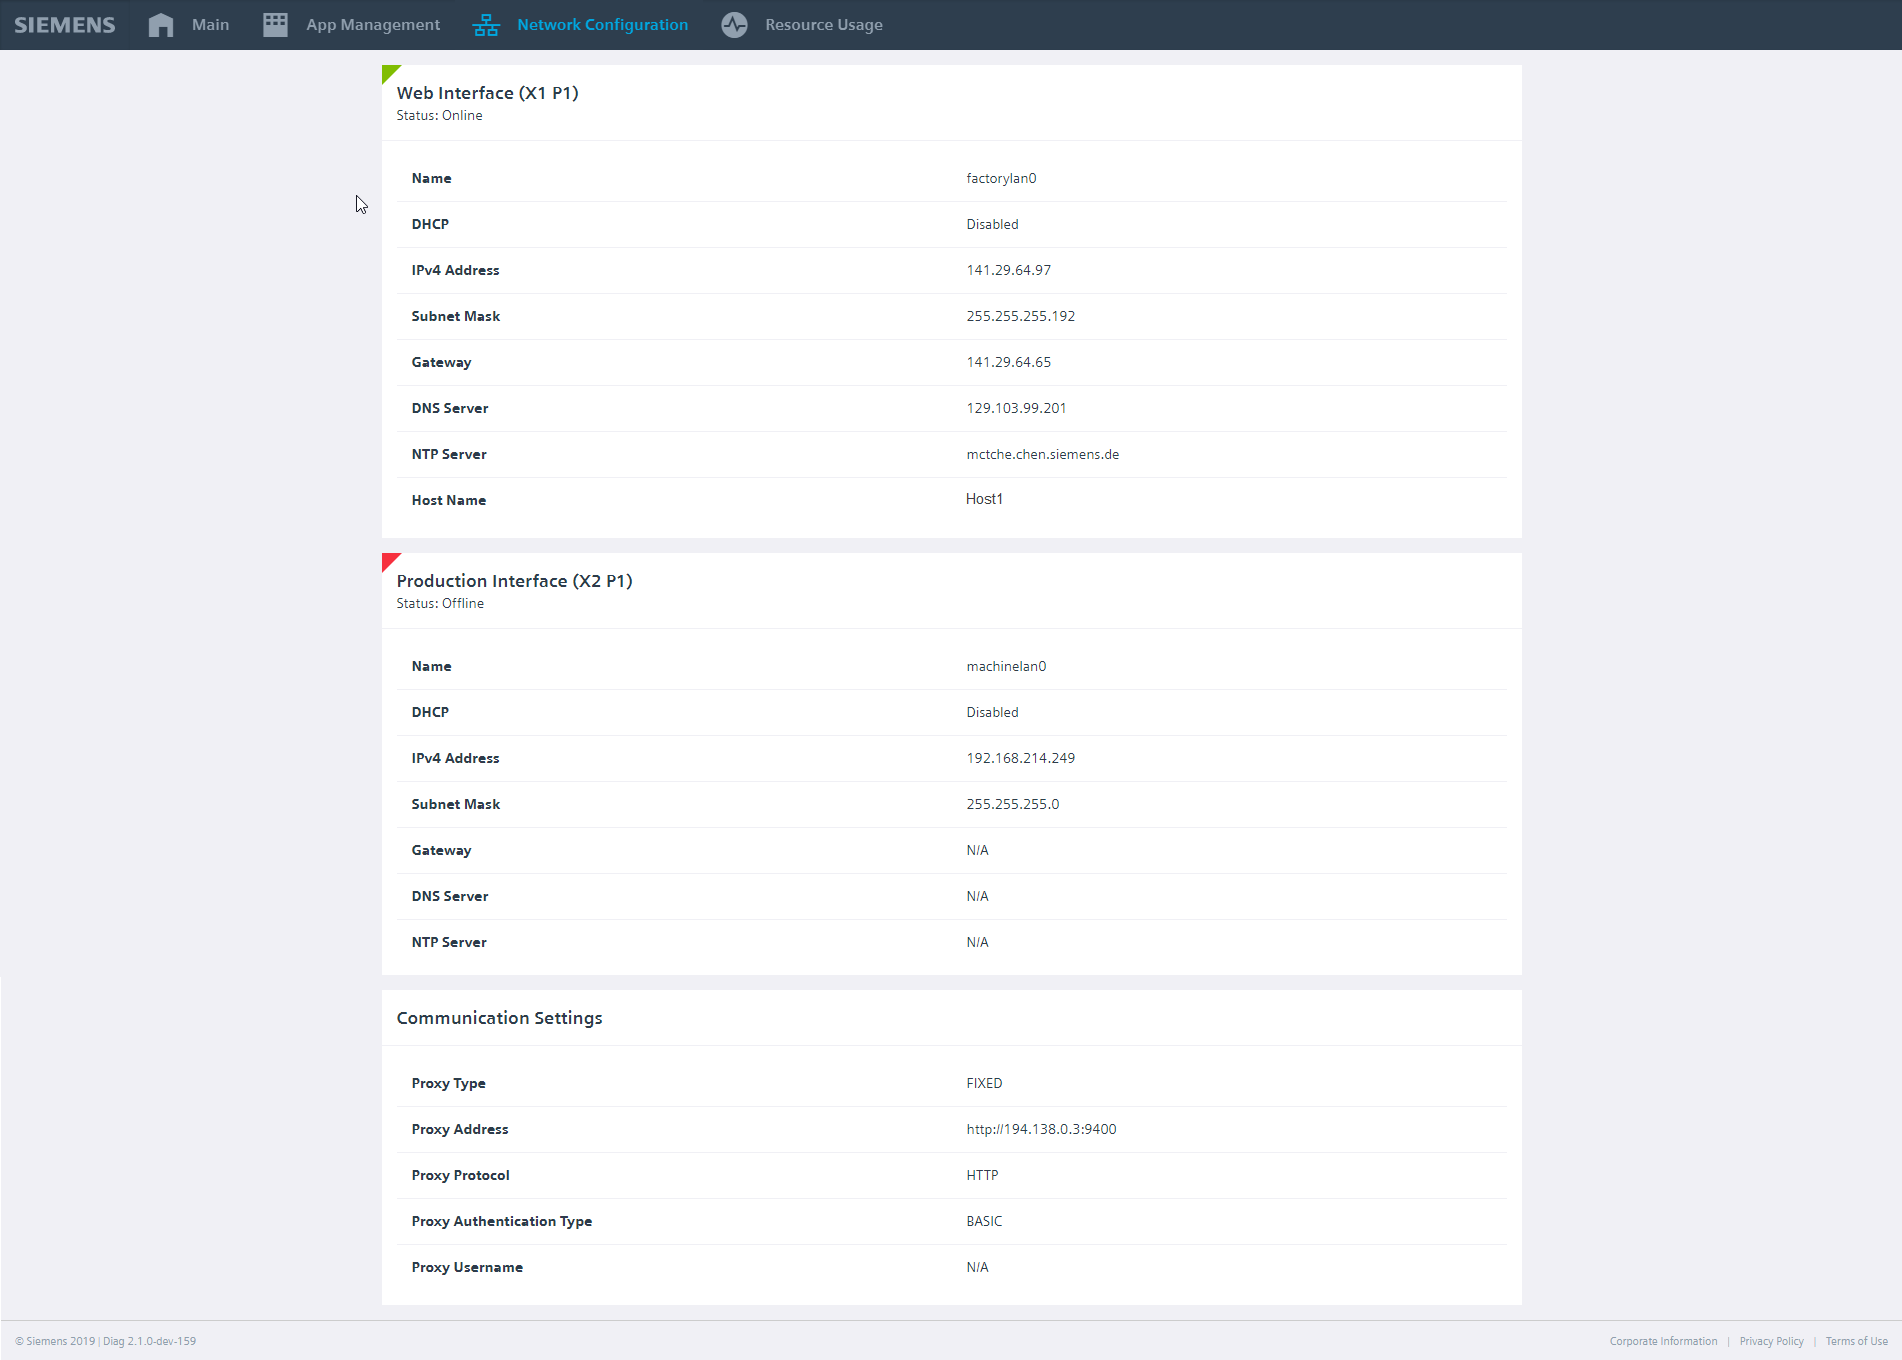
Network Configuration
In network configuration, it is possible to inspect different network interfaces, their configurations and current status of these network interfaces. Proxy information of Edge Device is also shown in this part of application.
Resource Monitoring
In resource monitoring page it is possible to see system and application resource usages.
Diagnostic of Internal Communication
The Adapter Framework provides a website to view information about the system's configuration status. This can be found in the dashboard of the SINUMERIK Edge. Navigate to App Management -> System Apps -> adapterframework and click the button “Open UI”. This button is available after you install the application from Insights Hub to SINUMERIK Edge. You will find a set of different sections, including diagnostic information of the system's current configuration.
Time of Configuration
The timestamp (SINUMERIK Edge local time) of the last valid configuration job.
Attention: In some circumstances, a configuration job fails and the system does a rollback to the last valid configuration. In this case, the timestamp will show the time of the failed configuration job, even if the active valid configuration is older. Please always review the active configuration sections as well.
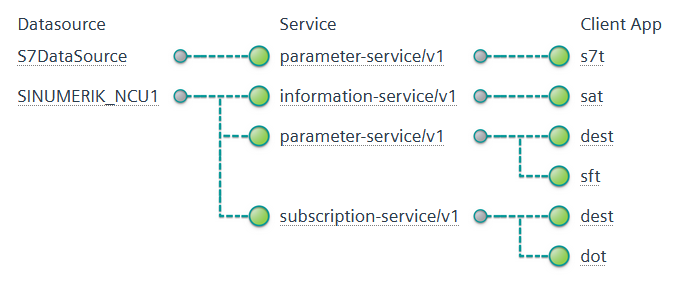
active configuration – client app oriented view
In this section you can find a graphical view of installed consumer applications and the services they request. Green bubbles indicate a successful configuration, while red bubbles indicate an error. Additional information is shown as a tooltip when the mousepointer is hovered over the text.
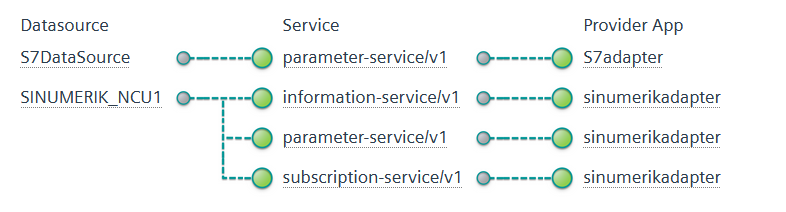
active configuration – service providers oriented view
In this section you can find a graphical view of available datasources and services which are used by consuming applications. Green bubbles indicate a successful configuration, while red bubbles indicate an error. Additional information is shown as a tooltip when the mousepointer is hovered over the text.
adapter framework raw json Configuration Data
The current configured routing information of the AdapterFramework.
Remark: Only services routed by the AdapterFramework are listed here. Not every consumer service is routed by the AdapterFramework. As such, the subscription-service/v1 will not be found in the routing information; this service is routed by the databus message broker.
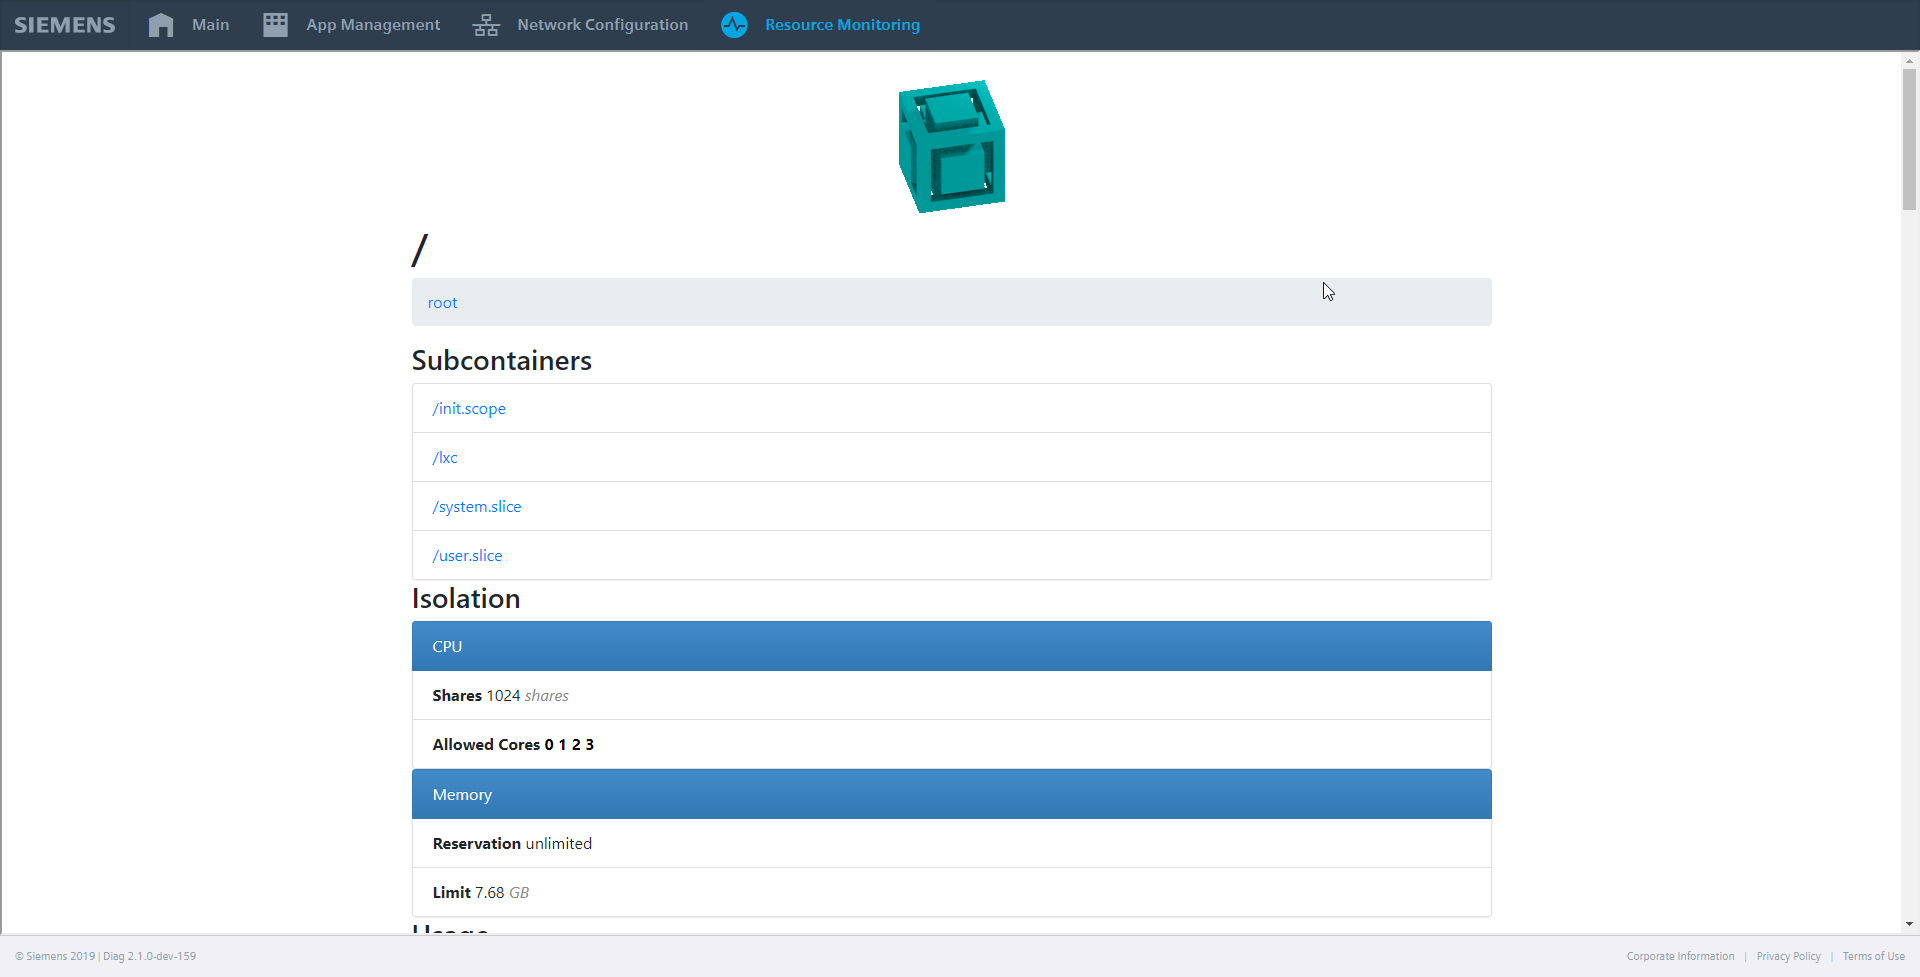
Local Resource Monitoring
This is a tool for monitoring the local system's usage of CPU, memory and disk in realtime. Users can view the resource usage and statistics for the base system (root), exenia or for each seperate container within exenia.
Warning
Users should avoid opening multiple local sessions of the resource monitoring tool. Only one client session is supported.
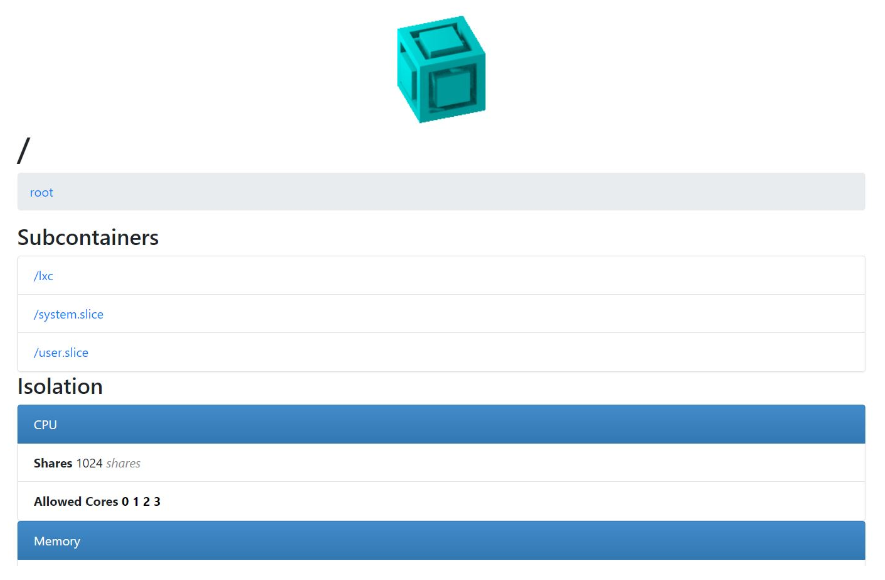
Resource monitoring for the base system
Users can view the CPU, memory and file system usage in realtime for the base system.
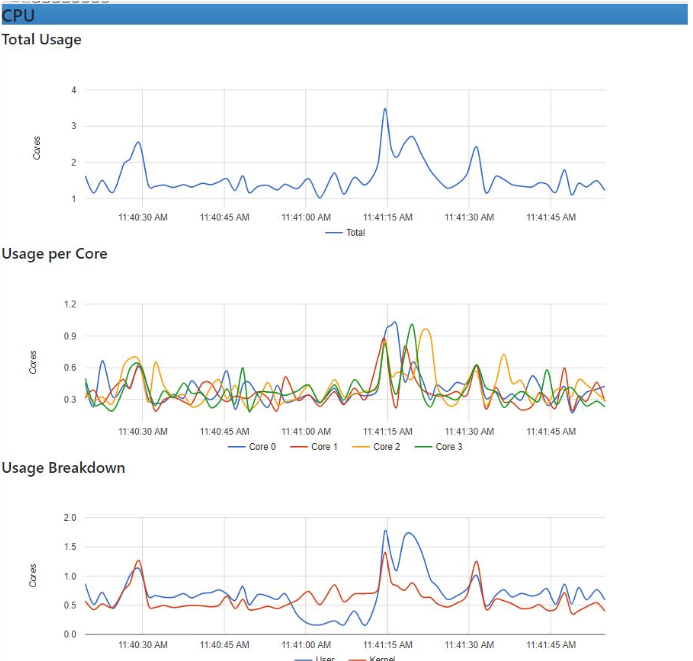
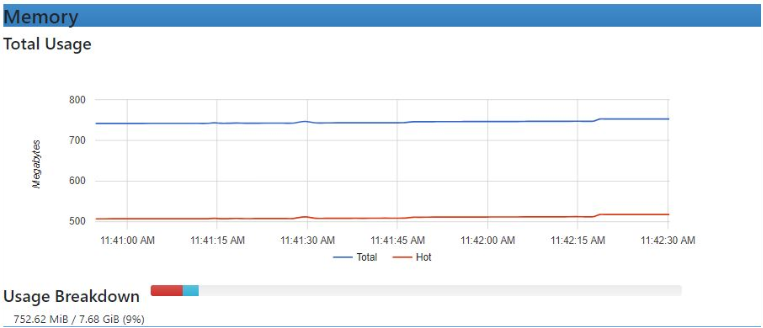
Resource monitoring for exenia
Users can view the CPU, memory and file system usage in realtime for exenia.
Users can access the exenia view from root/lxc for overall monitoring and root/lxc/exenia for individual processes' resource usage.
Resource monitoring for apps/exenia containers
Users can view the CPU, memory and file system usage in realtime for each application.
Specific containers can be accessed from root/lxc/exenia/<CONTAINERNAME>.
Any questions left?
Except where otherwise noted, content on this site is licensed under the The Siemens Inner Source License - 1.1.