
Web Components for Insights Hub and Industrial IoT
Event handling
Web Components for Insights Hub and Industrial IoT support standard CustomEvents. For general information refer to this link.
Web Components data is provided in the detail property of events. Each Web Component has a unique data model which serves as interface description. For example the Asset View provides the selectedAssetChanged event. Its model IAsset is described in the interface description.
Analyze an Event
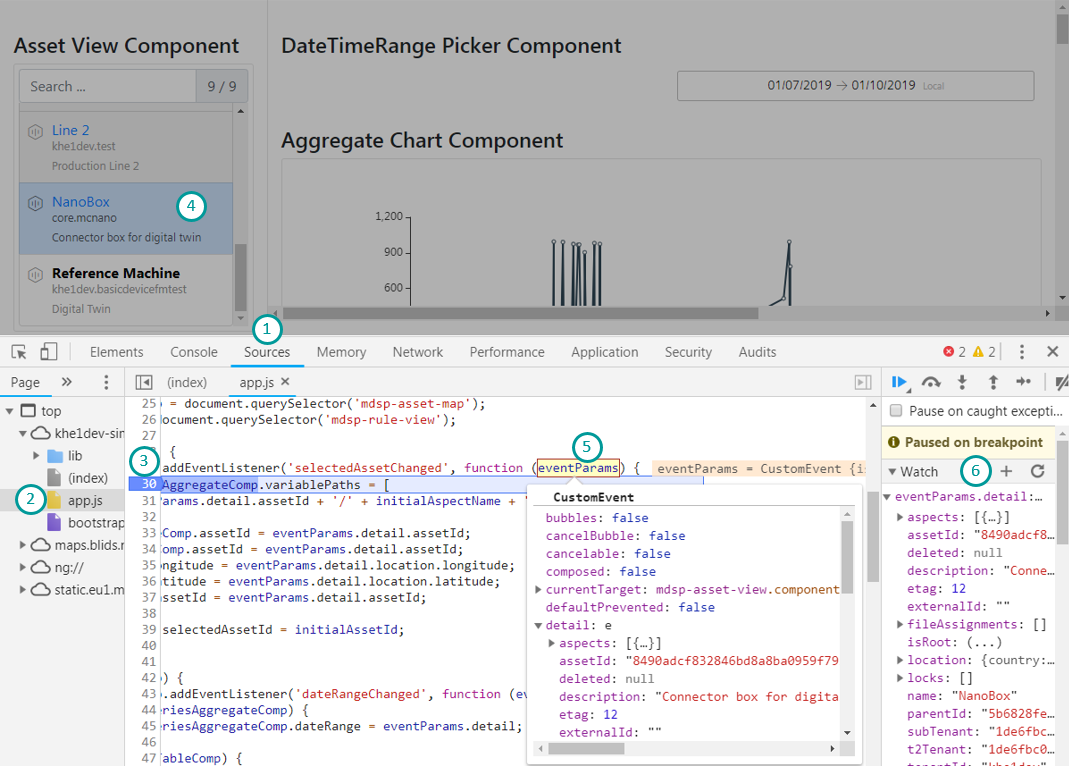
- Open the developer tools of your browser (press F12).
- Navigate into the sources section.
Chrome: Sources
Firefox: Debugger > Sources. - Select the file you want to debug from the file tree.
- Click on a line number to set a breakpoint.
- Trigger the event, e.g. the
selectedAssetChangedevent by selecting a different asset. - Open the properties of the event via mouseover.
- Add the event to the watch list if desired.
Related Links
Last update: February 23, 2024
Except where otherwise noted, content on this site is licensed under the Development License Agreement.