
Web Components for Insights Hub and Industrial IoT
MCEA View Chart
Info
This component requires access to MindConnect Edge Analytics and the related roles and scopes.
Only this application provides the necessary files for displaying complex data.
You can purchase the application in the Store.
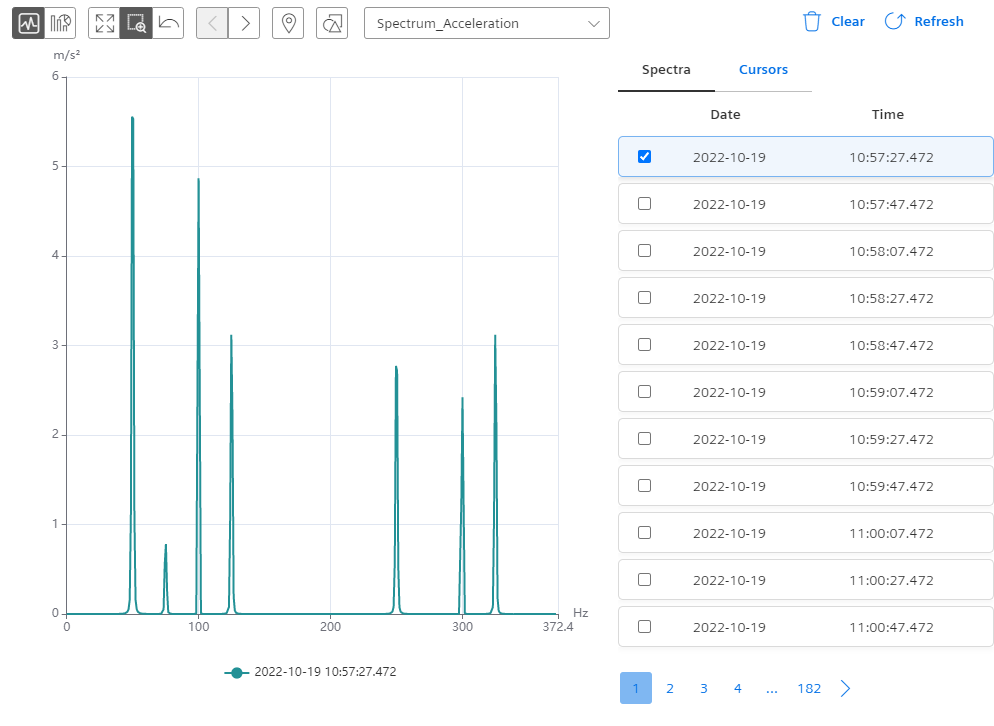
The MCEA View Chart displays complex data like FFTs calculated and uploaded by MindConnect Edge Analytics.
A list of available files is provided in the spectra tab, where data can be selected, to display it. The listed entries are dependent on the selection of the Asset and the time interval. Multiple entries can be selected to displayed and compare them with each other.
Within the Cursors tab, Frequency Markers of assigned Components by Edge Analytics can be displayed and configured.
Within the chart area, the data is displayed. With available toolbar buttons, the following functionality is provided:
- Line chart
- Bar chart
- Move axis
- Zoom axis
- Undo zoom
- Previous file
- Next file
- Enable/disable Cursors
- Enable/disable data markers
- Data type selection
Examples
Interface
Selector
<mdsp-mcea-view-chart></mdsp-mcea-view-chart>
Properties
| Name | Type | Corresponding attribute | Default | Description | Allowed Values |
|---|---|---|---|---|---|
| assetId | string | asset-id | Configures the asset whose data are displayed using its asset ID. | ||
| context | string | context | Configures the context of the component. See also here. | ||
| dataDateRange | TimeZoneDateRange | Specifies the date range using from, to, isAllDay and timeZone properties. | |||
| errorNotification | boolean | error-notification | Enables error control if an error is thrown. This can be used for debug purposes. For productive use, the error event should be caught and handled in the application. See also here. | ||
| fromDate | Date | Specifies the earliest date of the data to be displayed. | |||
| locale | string | locale | Specifies the locale in which the component is displayed. The locales en and de are provided by default.See also here. | ||
| localeManager | LocaleManager | Returns a LocaleManager object. This can be used to add locales or to get the locale settings. See also here. | |||
| timeZone | TimeZone | time-zone | Specifies the selected time zone. | ||
| toDate | Date | Specifies the latest date of the data to be displayed. |
Events
| Name | Type | Description |
|---|---|---|
| selectedFileChanged | EventEmitter<any> | Triggered when the selection of a data file changes. |
| dateRangeChanged | EventEmitter<IDateRange> | Triggered when the date range changes, e.g. when the user zooms or moves inside the chart. |
| connected | EventEmitter<any> | Triggered after the component is created, initialized and appended to the DOM tree. |
| error | EventEmitter<MdspUiError> | Triggered when an error occurs in the component or while accessing APIs. See also here. |
Models
TimeZoneDateRange
```typescript interface TimeZoneDateRange { from: Date; to: Date; isAllDay: boolean; timeZone: TimeZone; }
TimeZone
enum TimeZone {
    Local = 'Local',
    UTC = 'UTC',
}
Roles
mdsp:core:iot.filxxx(IoT File API is used - the component supports only read-functionalities)mdsp:core:iot.timUser(IoT TimeSeries API is used)
Snippets
List up and display files of a specific Asset
Only HTML
<mdsp-mcea-view-chart asset-id="yourAssetId"></mdsp-mcea-view-chart>
HTML and Javascript
<mdsp-mcea-view-chart></mdsp-mcea-view-chart>
const mceaViewChartComp = document.querySelector('mdsp-mcea-view-chart');
mceaViewChartComp.assetId = 'yourAssetId';
Except where otherwise noted, content on this site is licensed under the Development License Agreement.