Using a9s LogMe
Stream Application Logs to LogMe
To use a9s LogMe with an application, create a service instance and bind the service instance to your application. For more information on managing service instances, see Managing Service Instances with the cf CLI.
View the Service Offering
After the tile is installed, run cf marketplace to see logme service offering and its service plans.
$ cf marketplace
Getting services from marketplace in org test / space test as admin...
OK
service    plans                 description
logme      logme-xs, logme-m     This is the anynines LogMe service.
Create a Service Instance
Provision a LogMe instance with an arbitrary {instance_name}.
cf create-service {service_name} {plan_name} {instance_name}
cf create-service logme logme-xs my-logme-service
Depending on your infrastructure and service broker utilization, it may take several minutes to create the service instance.
Run the cf services command to view the creation status. This command displays a list of all your service instances. To view the status of a specific service instance, run cf service {instance_name}.
Bind the Logme Service to Your Application
After the LogMe service instance is created, bind the LogMe service to any applications whose logs should be streamed.
cf bind-service {app_name} {instance_name}
cf bind-service my-app my-logme-service
Restage or Restart Your Application
To enable your application to access the service instance, run cf restage or cf restart to restage or restart your application.
Get Dashboard Address, Login and Authorize
- Get the dashboard URL using
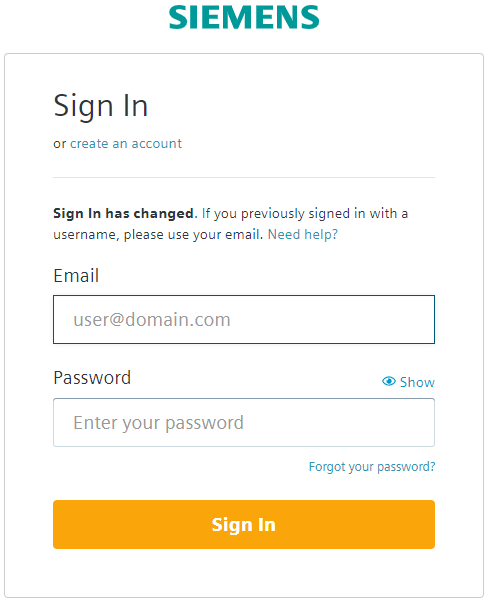
cf service my-logme-service.Service instance: my-logme-service Service: logme Bound apps: my-app Tags: Plan: logme-xs Description: This is the anynines LogMe service. Documentation url: https://a9s-logme-dashboards.your-domain.com/service-instance/a89f3114-5e77-40a5-b3b0-34a9741f3cd5 Dashboard: Last Operation Status: create succeeded Message: Started: 2017-07-22T17:10:21Z Updated: 2017-07-22T17:13:26Z - Enter the dashboard URL into your browser and authenticate with your WebKey user.
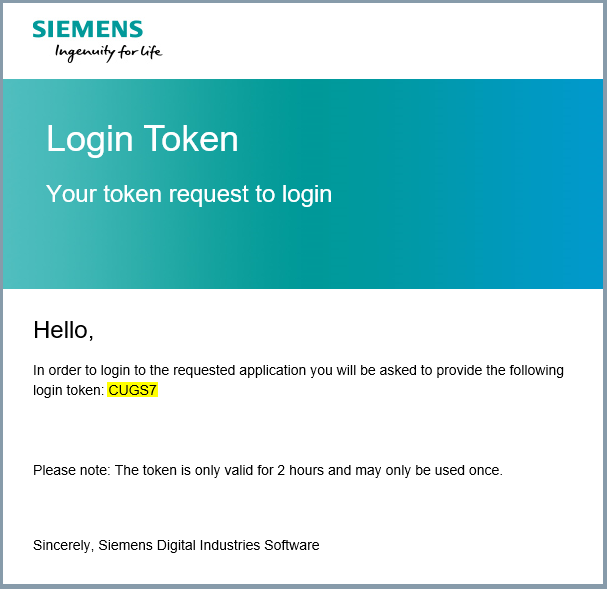
- You will be prompted to enter your login token.
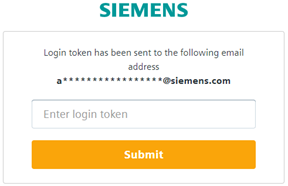
The login token will be sent to you by email. Copy your login token from email and paste it in "Enter login token" field. Click Submit.
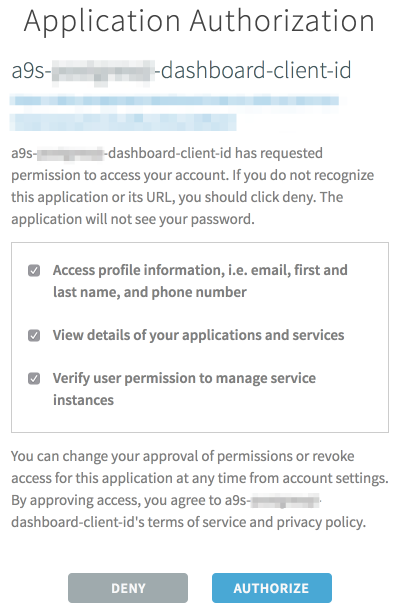
- Click Authorize to approve the authorization request.
Info
After creation of a new LogMe instance it may take several minutes until dashboard is available and can be opened.
Backup and Restore Service Instances
a9s LogMe provides an easy way to create backups and restore if needed.
Perform a Backup
On the dashboard, you can trigger a backup by clicking on the Settings icon and selecting Manually Trigger A Backup.
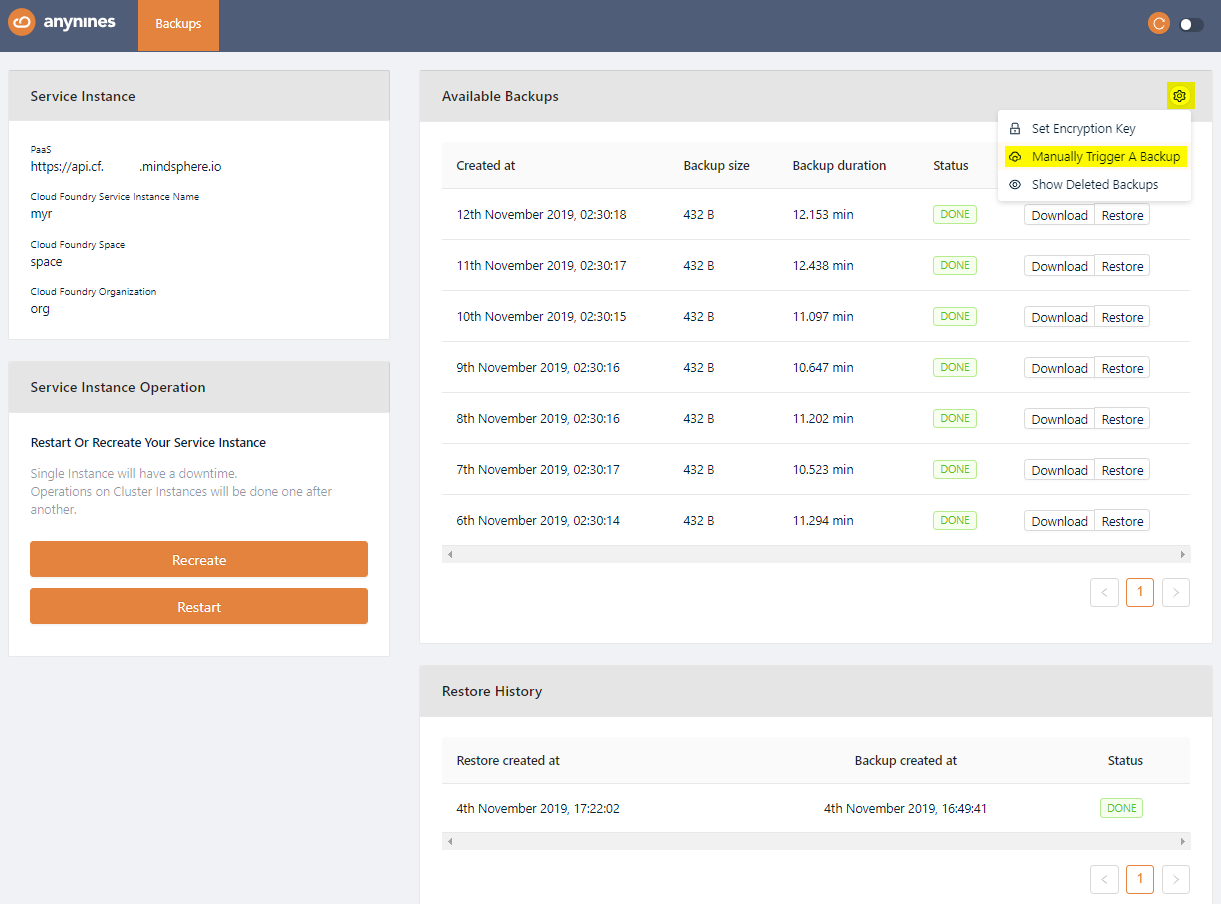
After a short period of time, the backup will be queued. The backup process will start soon.
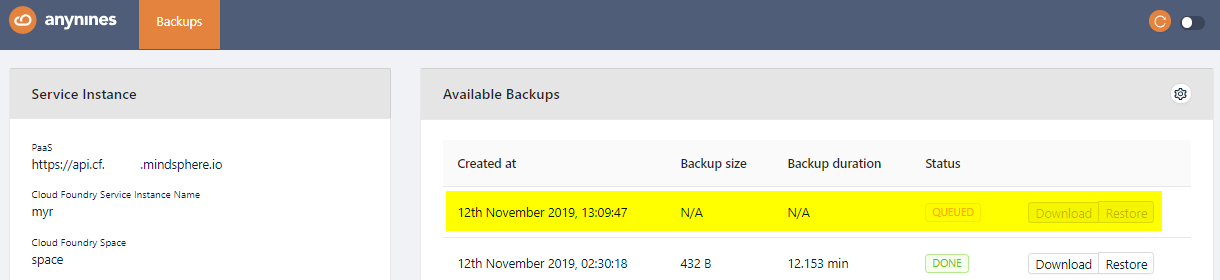
Note
Depending on the size of the data, the backup might take some time.
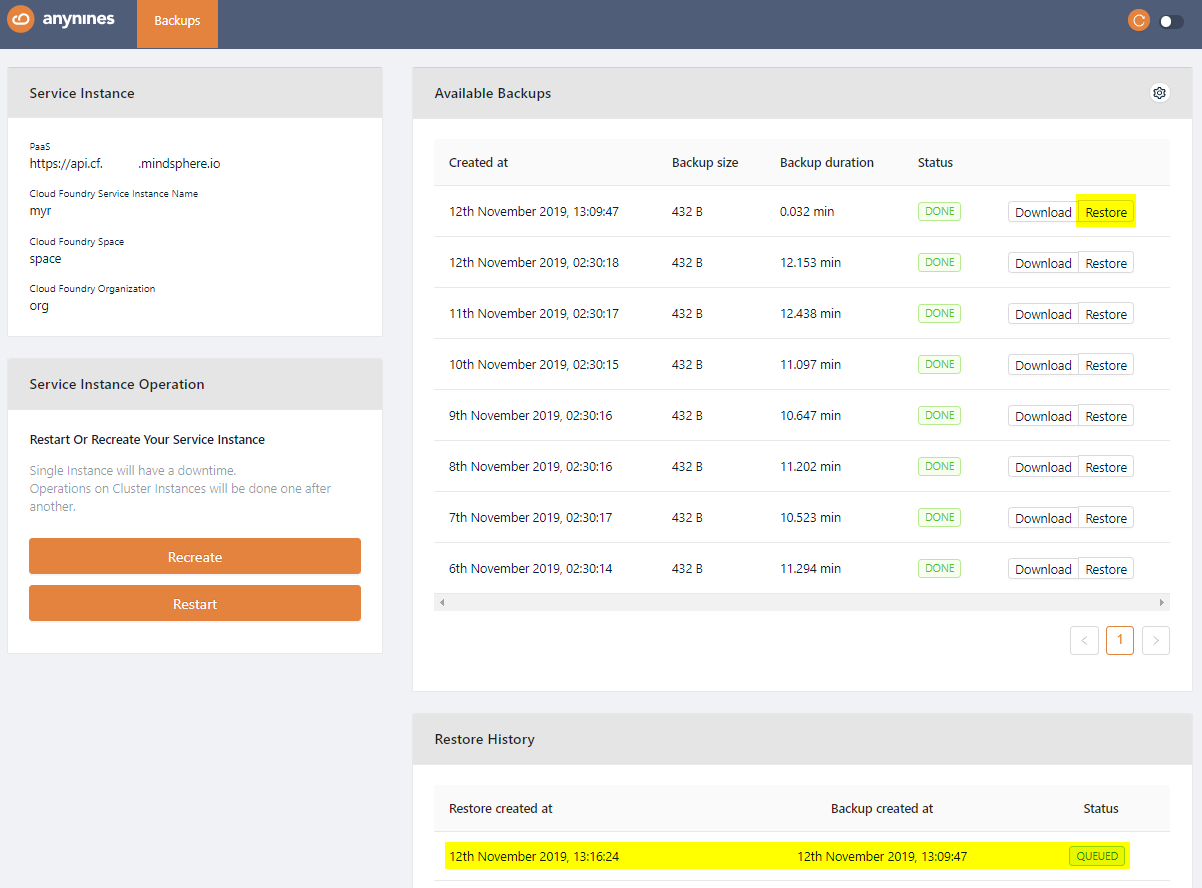
Restore a Backup
Open the dashboard again and select the backup you would like to restore. Click the Restore button of the backup. After a short period of time the restore will be triggered.
Note
Depending on the size of the data the restore might take some time.
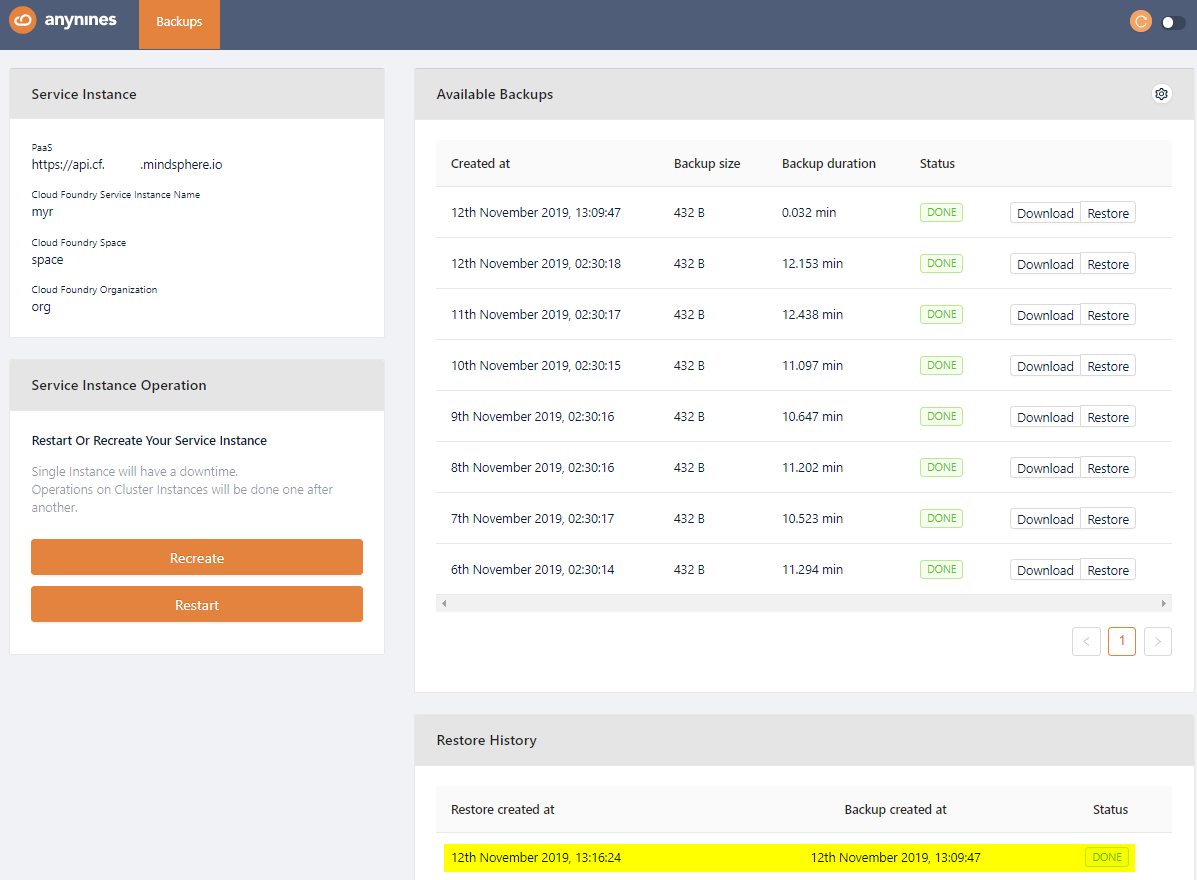
Info
When restoring a backup only indices in the backup will be restored. Indices which were created after backup creation will remain in LogMe.
LogMe creates a new index for every day.
See Your Application's Logs
Perform the following steps to see your application's logs:
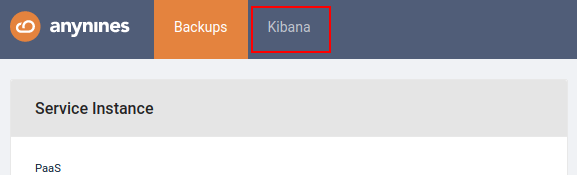
- Click Kibana tab to open the
Kibanadashboard
- In the dashboard that appears, specify the
Index name or patternand theTime-field name. For theIndex name or patternyou can use the suggested value.
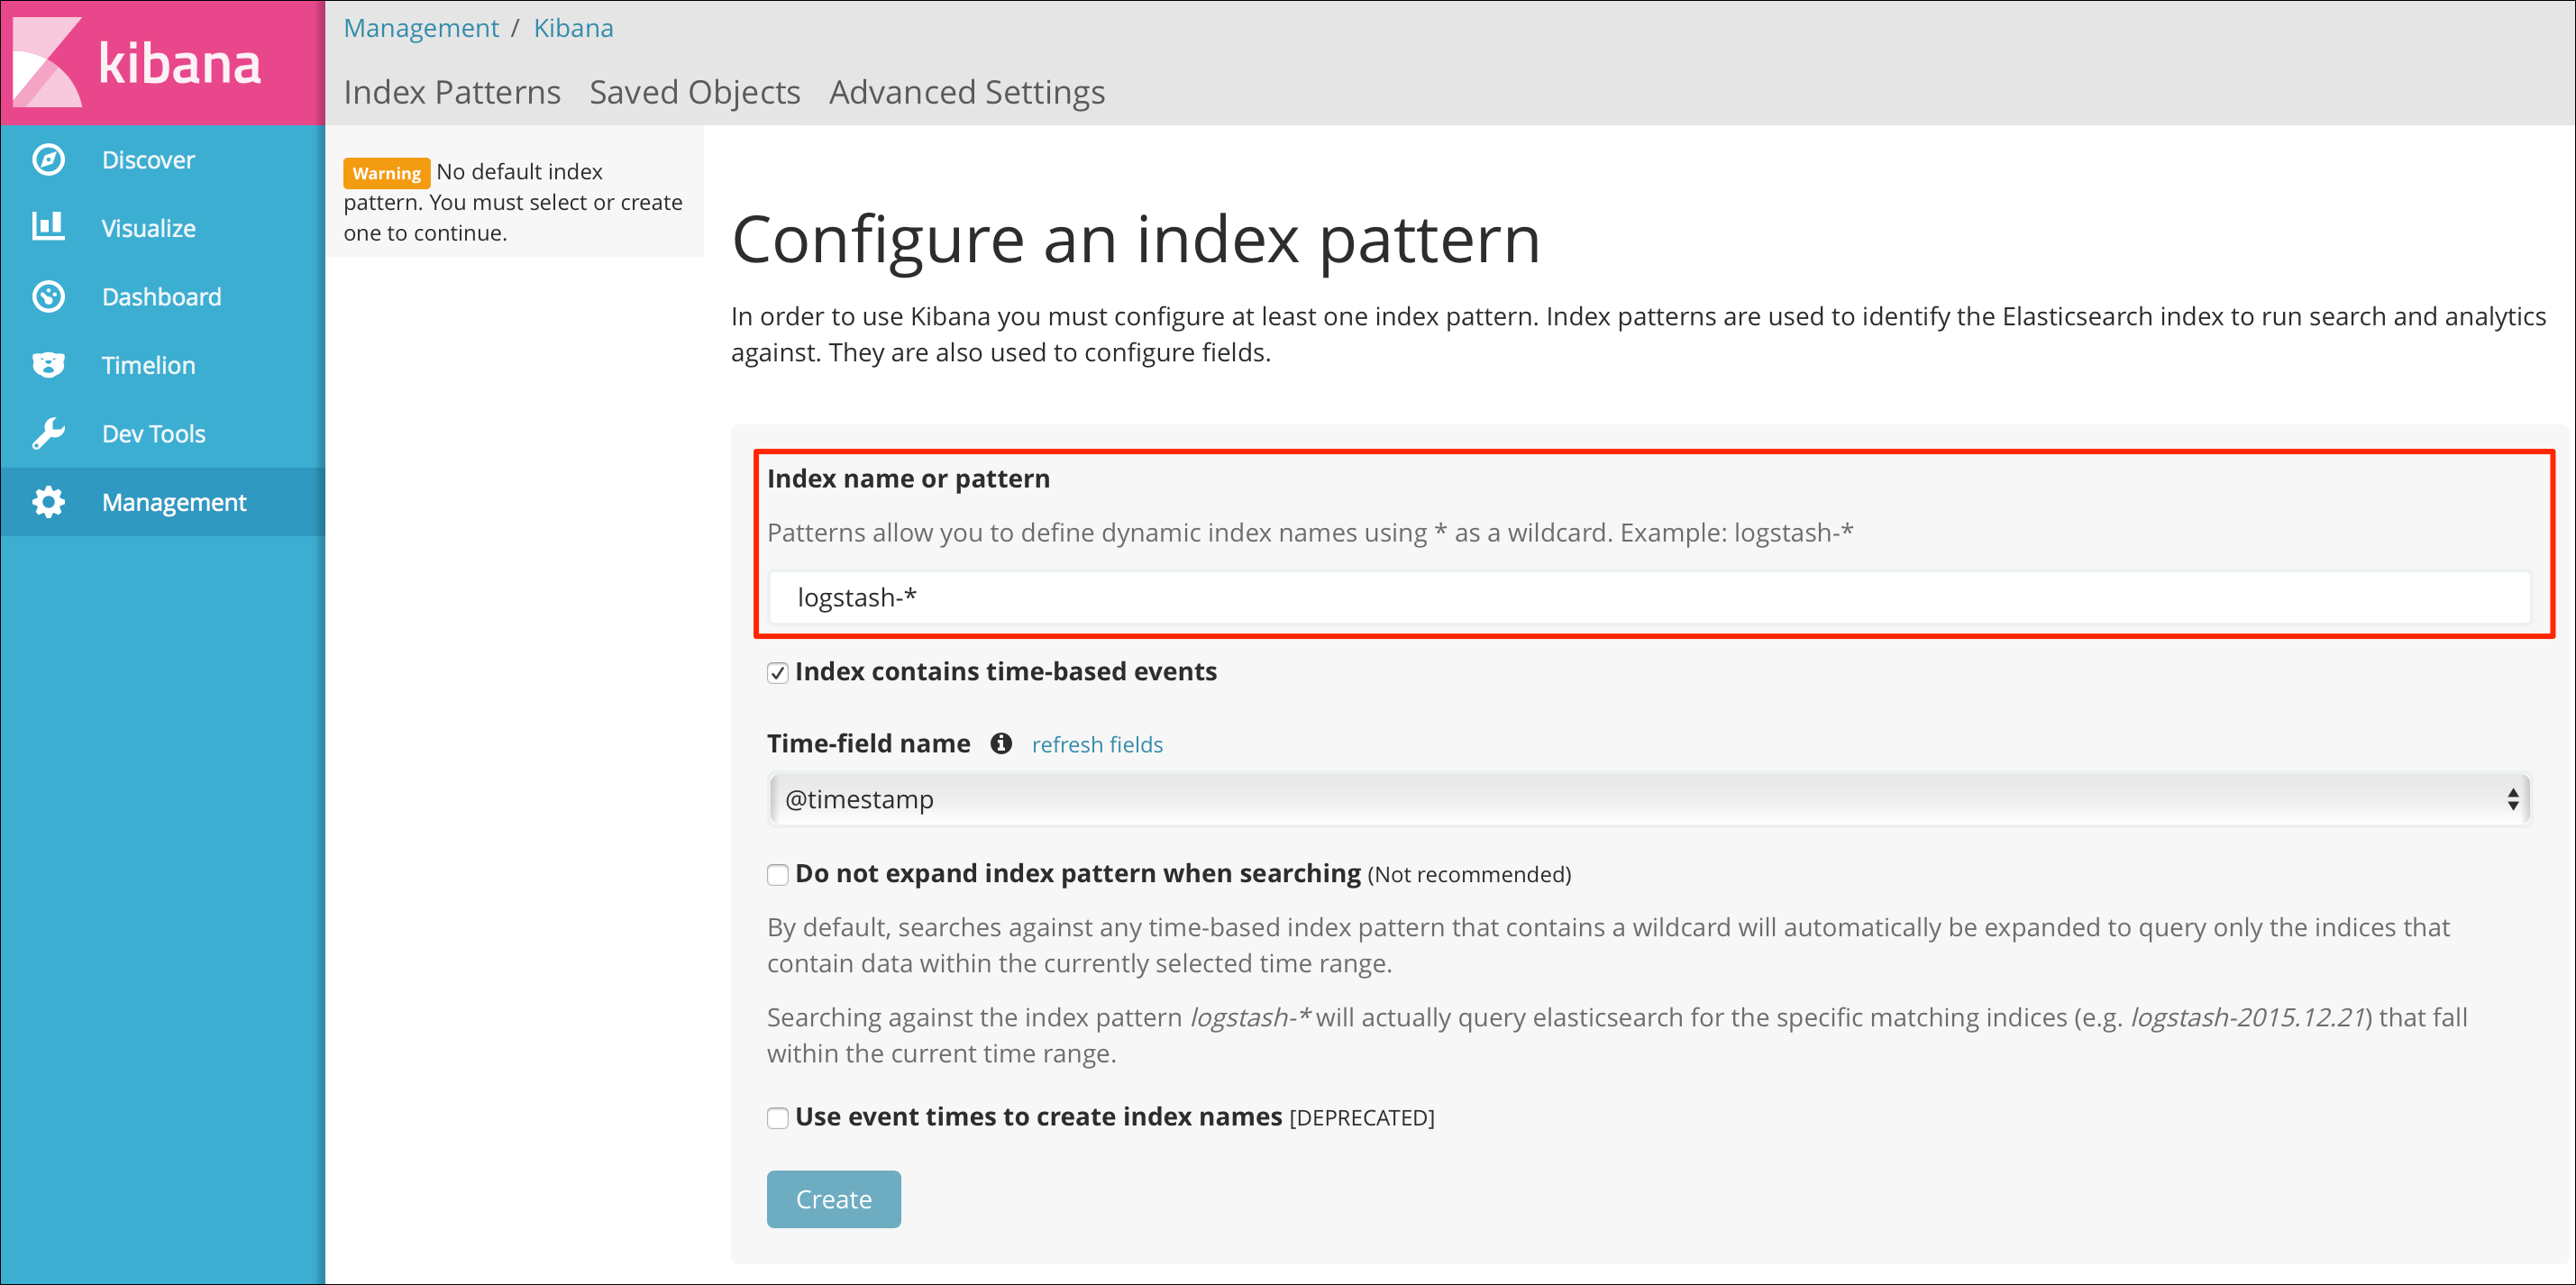 For the
 Time-field nameuse the only available value,@timestamp.
!!! info@timestampvalue will be available after some logs were written to LogMe instance. If@timestampisn't available, write some logs first.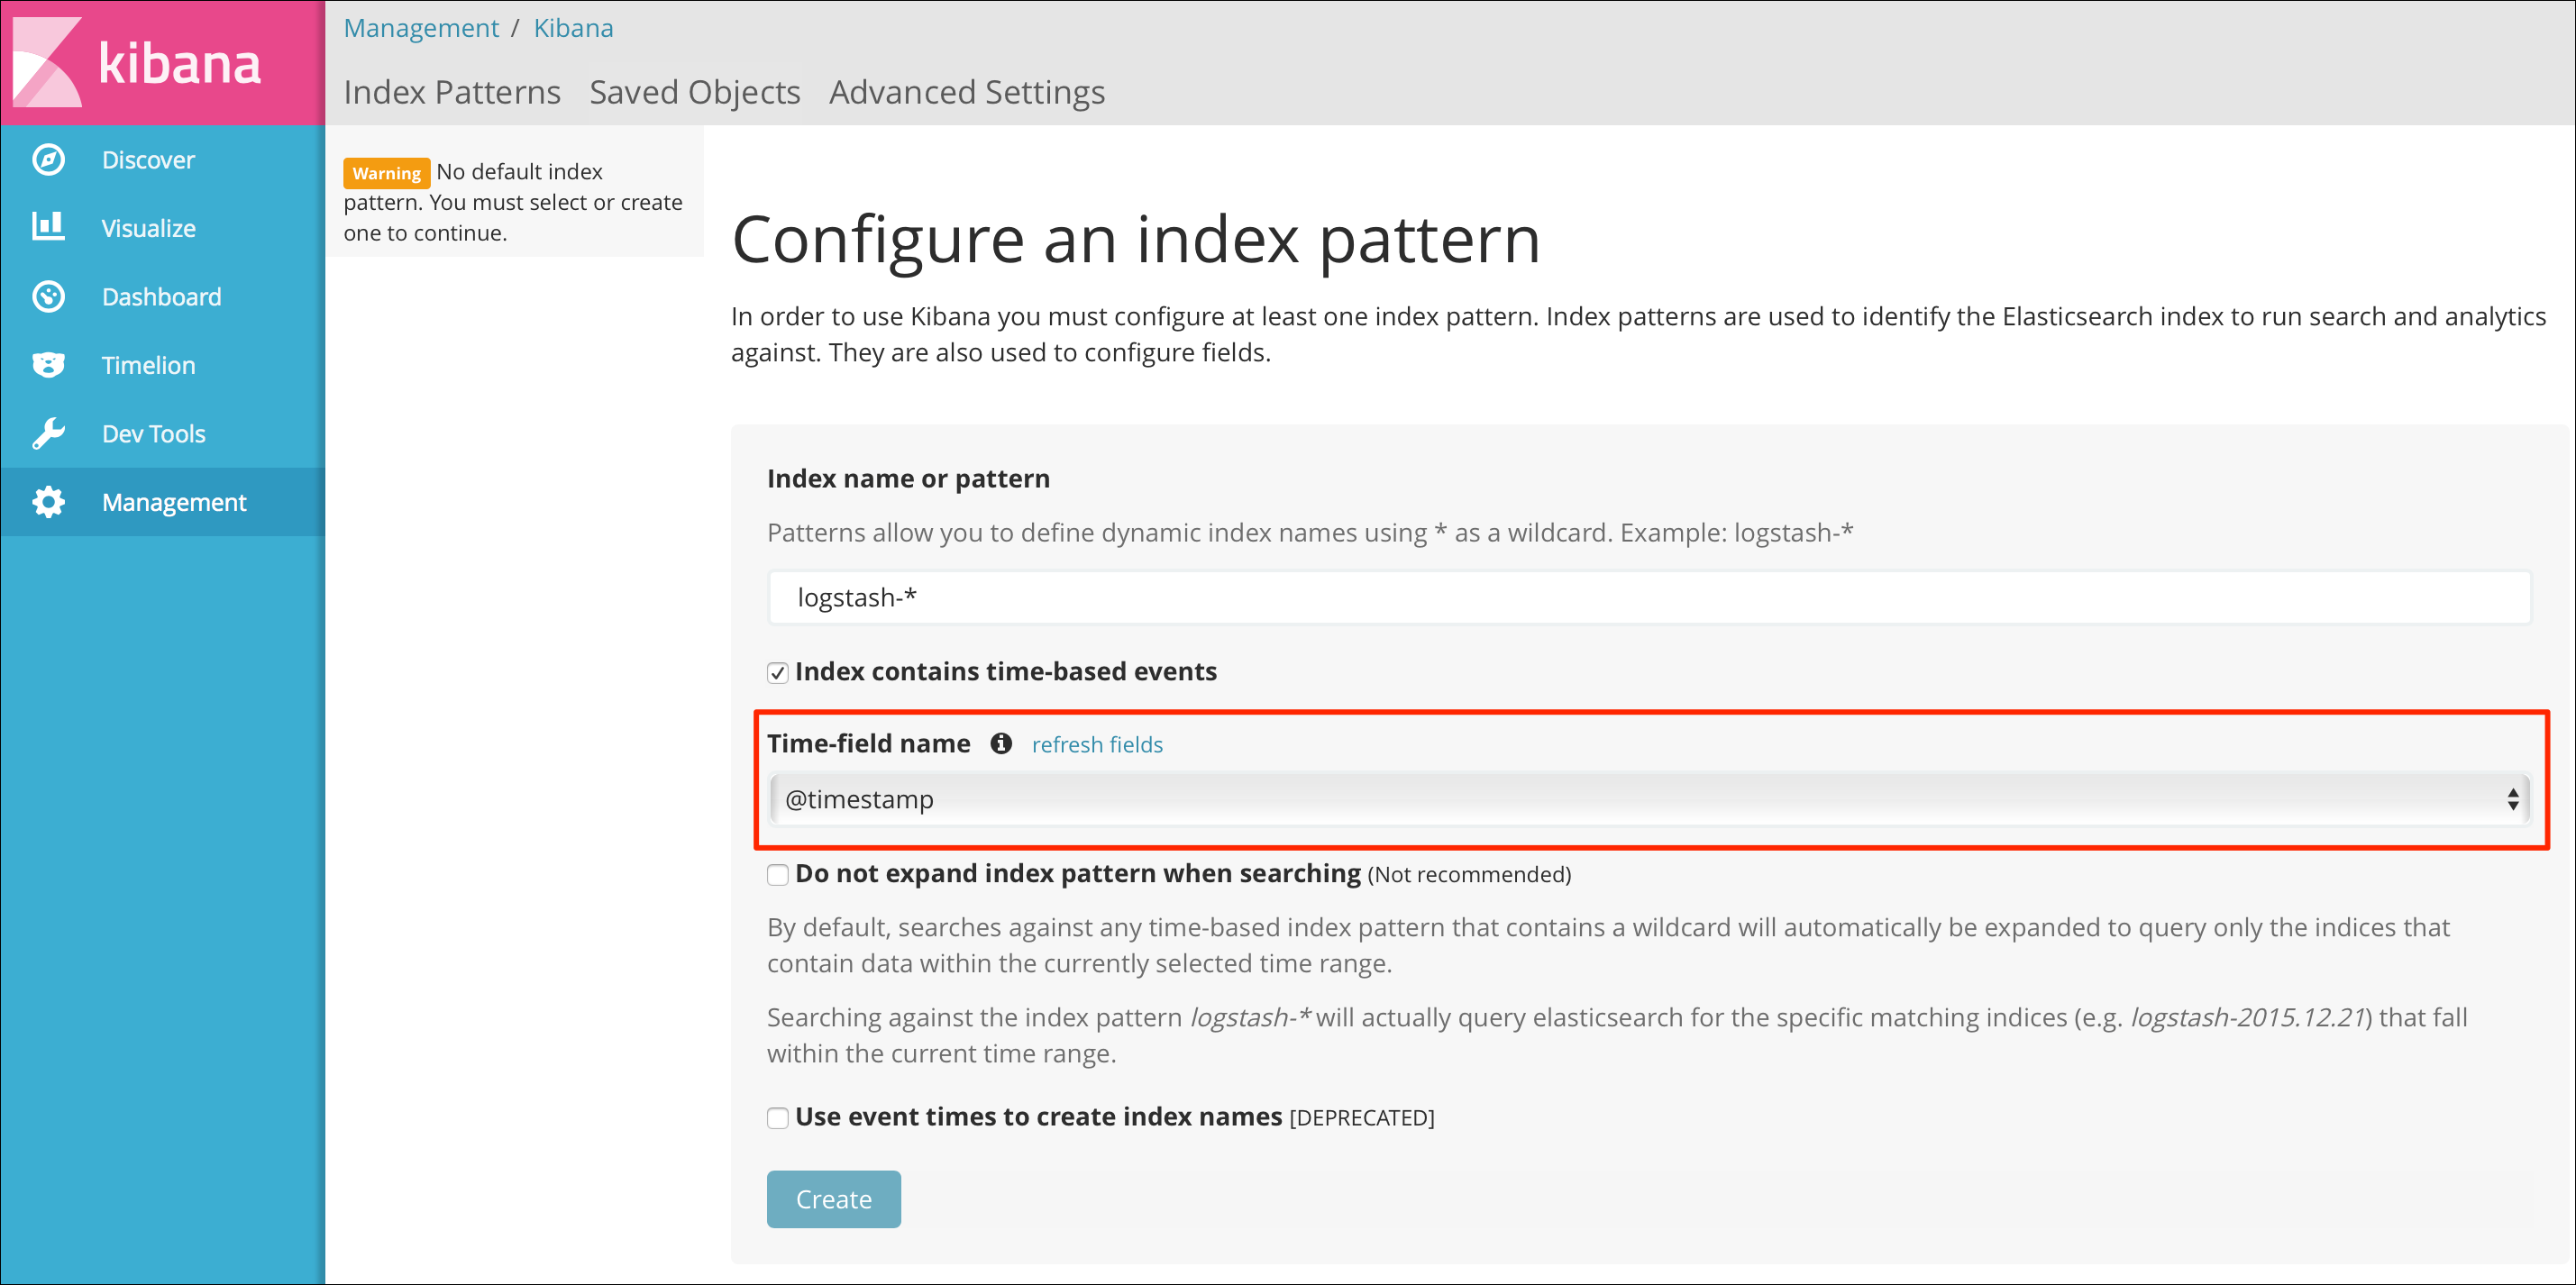
- Click Create to apply the settings.
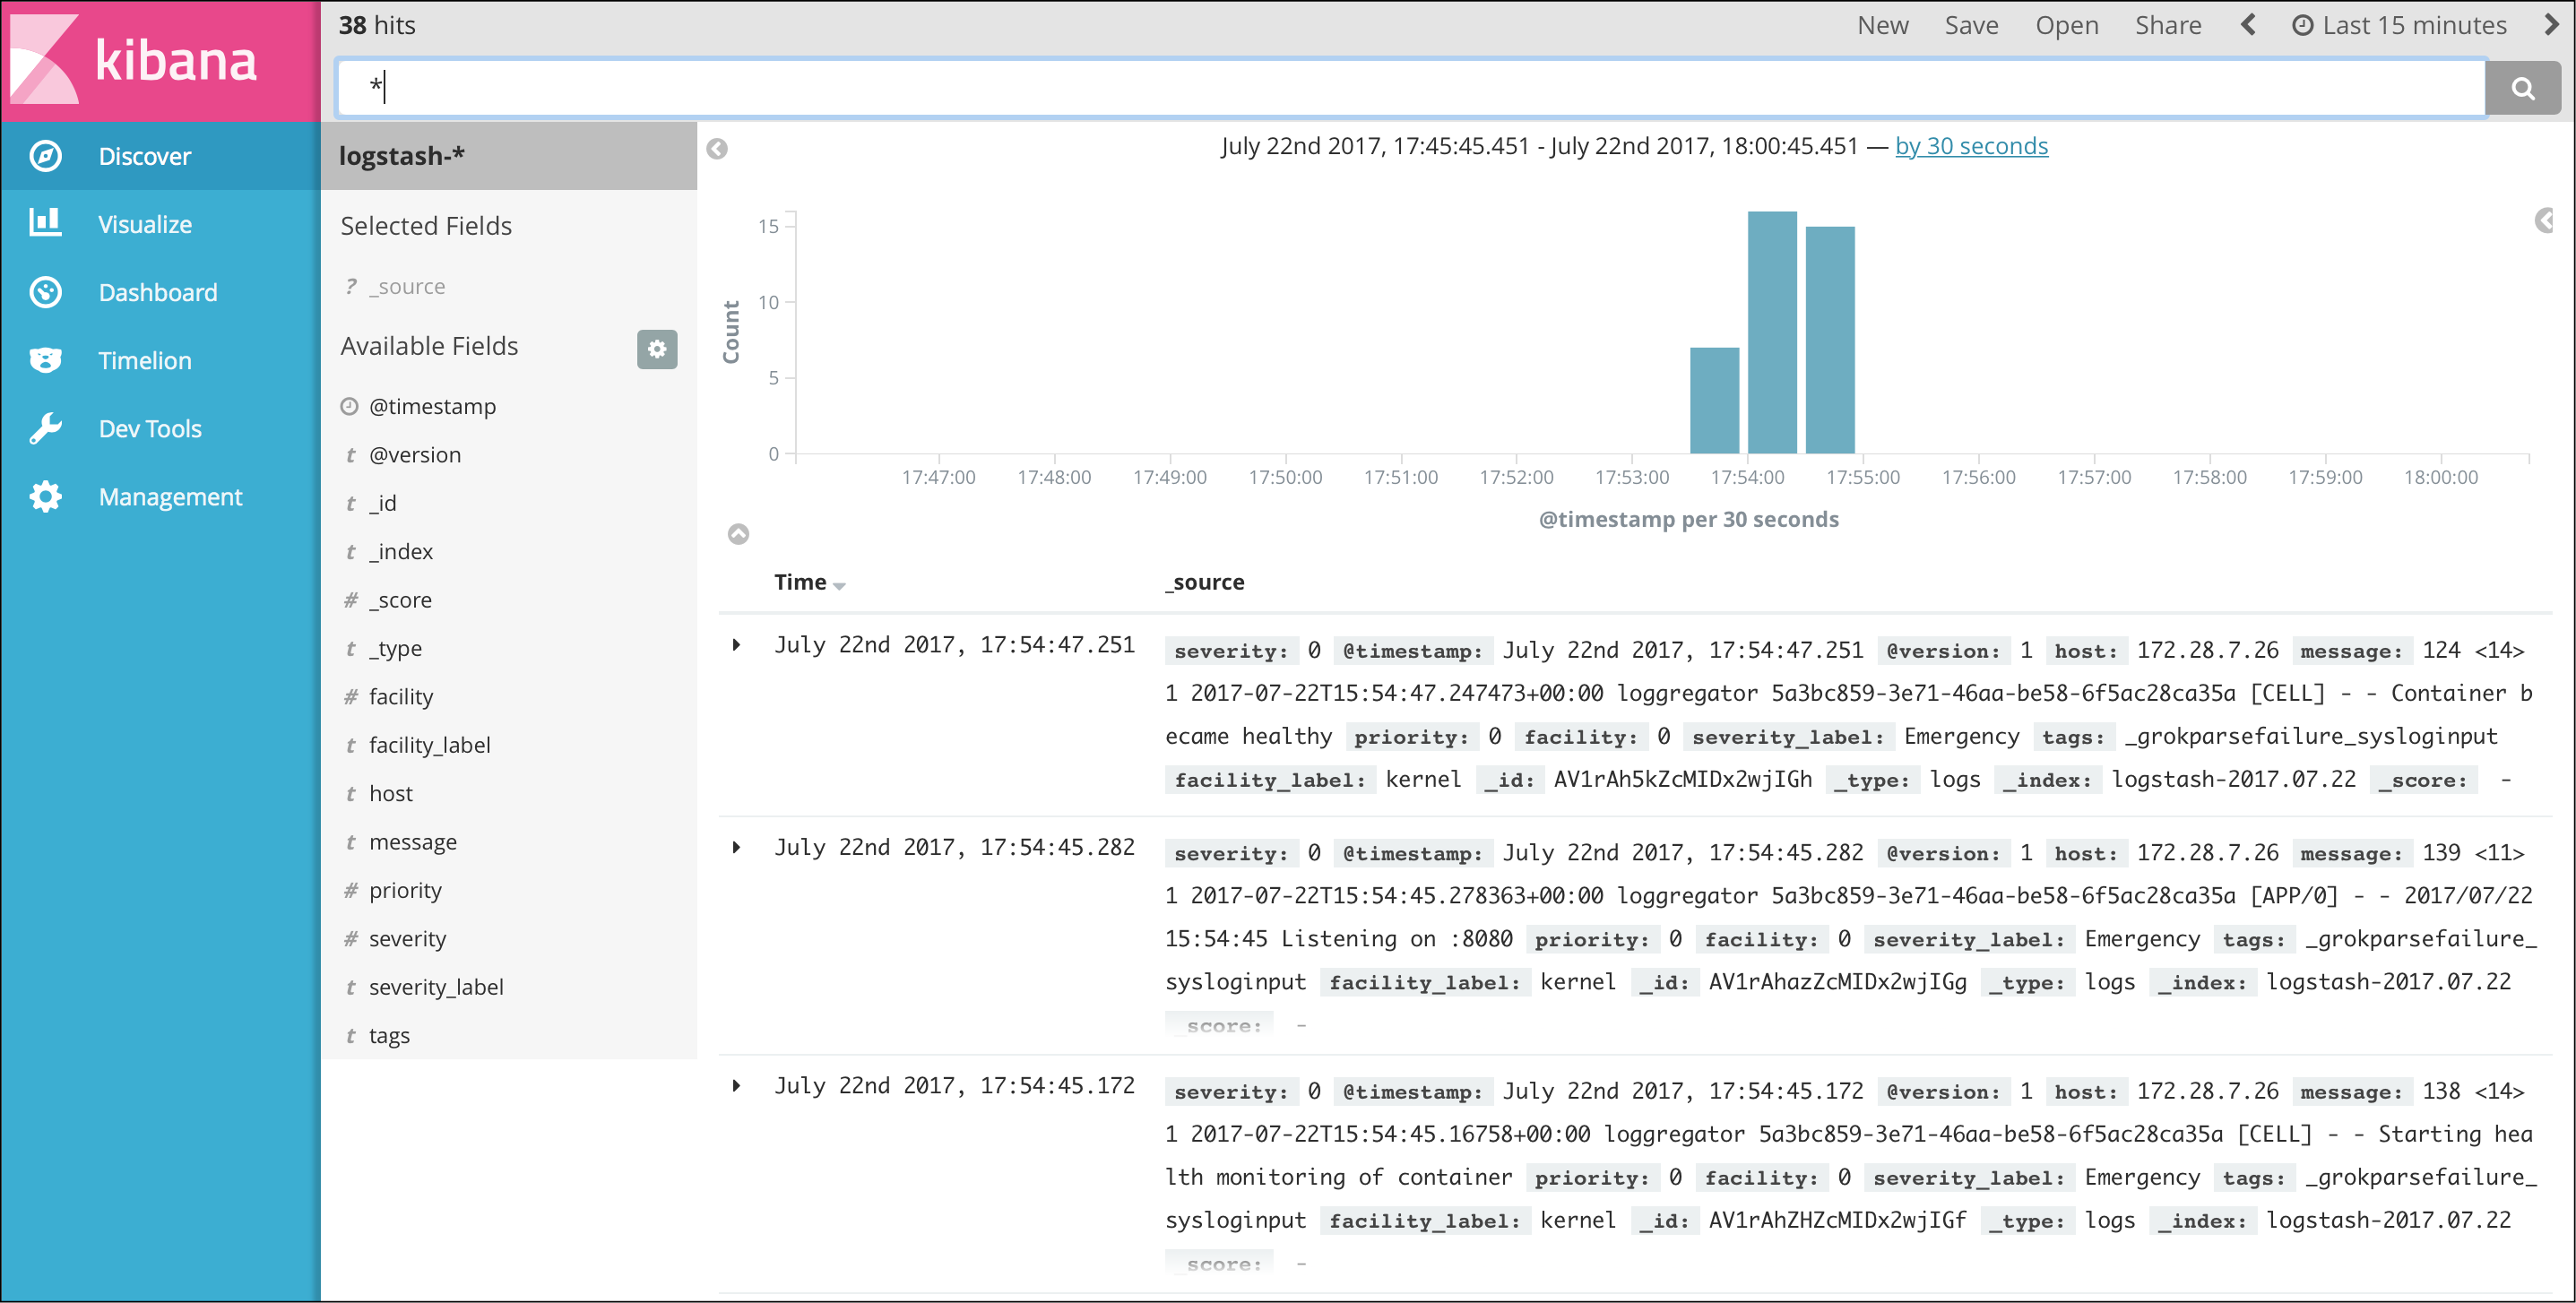
Your application's logs appear on the Discover tab of the dashboard:
Stream a9s Service Logs to LogMe
To use a LogMe service instance to monitor another service instance, create an a9s LogMe service instance first.
Create a Service Key
After the LogMe service is instantiated, create a new key for your service instance.
cf create-service-key {instance_name} {service_key}
$ cf create-service-key my-logme-service key1
$ cf service-key my-logme-service key1

{
"host": "syslog://d37f7da-logstash.service.dc1.consul:514",
"password": "a9sfd6e0d814e78c903290ebb5a7207b20c5f0a2653",
"username": "a9sed20b19c769f0804bc68b97d02cba86e9c3a0379"
}
Update Your Service
The cf update-service command used with the -c flag can let you stream your Syslog to a third-party service. In this case, the command expects a JSON string containing the syslog key. For this, you need to give the URL given by the cf service-key command as a value for the syslog key.
$ cf update-service service-instance-to-monitor -c '{"syslog": ["d37f7da-logstash.service.dc1.consul:514"]}'
You can delete the syslog endpoint settings by calling update-service with an empty array.
$ cf update-service service-instance-to-monitor -c '{"syslog": []}'
Stop Streaming Application Logs to LogMe
Follow the steps below to stop streaming the logs of your applications to LogMe.
List Available Services
Run cf services to list available service instances and get the name of the service instance you want to delete.
$ cf services

Getting services in org test / space test as admin...
OK

name                 service   plan         bound apps    last operation
my-logme-service     logme     logme-xs     logme-app     create succeeded
This example shows that the service instance my-logme-service is bound to the logme-app app.
Unbind the Service Instance
If your LogMe service instance is bound to an app, you need to unbind it first.
cf unbind-service {app_name} {instance_name}
cf unbind-service logme-app my-logme-service
Delete the Service Instance
cf delete-service {instance_name}
cf delete-service my-logme-service
It may take several minutes to delete the service. Deleting a service deprovisions the corresponding infrastructure resources. Run the cf services command to view the deletion status.
Upgrade the Service Instance to another Service Plan
Once created, you can upgrade your service instance to another larger service plan. A larger service plan provides more CPU, RAM and/or storage. The plans also differ in availability. For more information, refer to Service Plans.
cf update-service my-logme-service -p a-bigger-plan
Here are the plans you can upgrade to depending on the one you are currently using:
| From / To | xs | s10 | m50 | s10_ha | m | m150_ha |
|---|---|---|---|---|---|---|
| xs | - | yes | yes | no | no | no |
| s10 | no | - | yes | no | no | no |
| m50 | no | no | - | no | no | no |
| s10_ha | no | no | no | - | yes | yes |
| m | no | no | no | no | - | yes |
| m150_ha | no | no | no | no | no | - |
The left column shows your current plan and the first row shows the target plan.
Example:
If your current plan is logme-s10, it's possible to upgrade to logme-m50, but it is not possible to upgrade to logme-xs, logme-s10_ha, logme-m and logme-m150_ha.
Info
It is not possible to update from a non clustered LogMe instance to a clustered LogMe instance.
Custom Parameters
Data Retention
In order to clean up old Elasticsearch indices a tool called Curator runs periodically. By default, it deletes indices older than 30 days.
You can overwrite that configuration using the custom parameters curator_retention_unit and curator_retention_period, e.g.:
cf create-service a9s-logme logme-single-small my-logme-service -c '{ "curator_retention_unit": "days", "curator_retention_period": 90 }'
cf update-service my-logme-service -c '{ "curator_retention_unit": "hours", "curator_retention_period": 3 }'
For the curator_retention_unit you can use the following values: seconds, minutes, hours, days, weeks, months, years]. For the curator_retention_period you can use a positive integer value greater than zero.
User Defined Additional Groks
It is possible to define additional grok patterns, which will be matched against the message part of the syslog.
Uses of Grok
Assume we have the following syslog message:
<133>Feb 25 14:09:07 webserver syslogd: 123 additional-infomation 456
This syslog message is preprocessed by the logstash syslog input plugin.
After that preprocessing it has the following structure:
{... syslog specific parts of the log ... "message" : "123 additional-infomation 456" }
In the above example, the user defined additional groks are now matched against the value of the message field against "123 additional-infomation 456".
Assuming the following, additonal grok is defined:
"%{NUMBER:valueOne} %{WORD:someWord} %{NUMBER:valueTwo}"
The parsed result would be:
{
     ... syslog specific parts of the log ...
     "message" : "123 additional-infomation 456",
     "valueOne" => "123",
     "someWord" => "additional-information",
     "valueTwo" => "456"
}
In Kibana you will see additional columns "valueOne", "someWord" and "valueTwo".
Add Additional Groks
Additional groks are applied as custom parameter {"additional_groks":[/* List of additional groks */]}.
This can either be done during service creation or with update-service command:
During service creation:
cf create-service logme <service-plan> <service-name> -c '{"additional_groks":[{"pattern":"%{WORD:Some} %{WORD:Grok} %{WORD:Pattern}"}]}'
With update-service command:
cf update-service <service-name> -c '{"additional_groks":[{"pattern":"%{WORD:Some} %{WORD:Grok} %{WORD:Pattern}"}]}'
Each pattern is a JavaScript object with the fields "pattern", "additional_tags" and "additional_fields".
"pattern"(mandatory): Represents the grok pattern to match against."additional_tags": ["tagOne", ... "tagN"]: Optional array that contains strings which will be added as tags if the grok matches."additional_fields": {"keyOne":"valueOne", ... "keyN":"valueN"}: Optional hash that contains key-value-pairs which will be added as fields if the grok matches.
A minimal additional grok could look like:
{"additional_groks":[{"pattern":"%{GREEDYDATA:data}"}]}
A more complex additional grok could look like below:
{
  "additional_groks" : [
    {
      "pattern" : "%{WORD:Some} %{WORD:Grok} %{WORD:Pattern}"
    },
    {
      "pattern" : "%{GREEDYDATA:data}",
      "additional_tags" : ["tagOne", "tagTwo"],
      "additional_fields" : {
        "fieldOne" : "fieldOneValue",
        "fieldTwo" : "fieldTwoValue"
      }
    }
  ]
}
- For further information regarding the grok patterns, refer to available grok patterns.
- For debugging grok patterns, refer to Grok Debugger.
Info
The defined grok patterns will be processed sequentially. After a matching grok pattern was found, the log will not be validated against the subsequent grok patterns. For this reason, the order of grok patterns is important.
Warning
An invalid grok pattern may damage your logstah configuration and you will no longer see any logs in LogMe. Please refer to Best Practices Adding Grok Patterns.
Best Practices Adding Grok Patterns
- Test your grok in Grok Debugger before updating your service with additional grok.
- Test the additional grok in Developer Tenant before using it in Operator Tenant.
- If you want to use a complex grok pattern, it may be easier to define the json in a file instead of command line. With this you can avoid quote escaping issues. For more information, refer to Transfer json in file.
- Write some logs and check your log messages in LogMe Kibana dashboard after adding a new grok pattern.
- To reset to default grok patterns and repair you logstash configuration, refer to Remove Added Grok Patterns.
Remove Added Grok Patterns
If you want to remove all additional groks, apply the custom parameter with an empty array.
cf update-service <service-name> -c '{"additional_groks":[]}'
If you want to keep some additional groks, apply the custom parameter with that grok definitions included.
Info
When updating a service instance with "additional_grok" custom parameter, all additional groks that were set before will be lost.
Stop Streaming Service Logs to LogMe
Overwrite Your Service Configuration
Stop streaming your service instance logs to your LogMe instance, by updating the syslog key of your service configuration with an empty string.
cf update-service {instance_name} -c '{"syslog": [""]}'
cf update-service service-instance-to-monitor -c '{"syslog": [""]}'
Delete the Service Key and Instance
If you are not using it anymore, you may want to delete the service key and the service instance itself.
cf delete-service-key {instance_name} {service_key}
cf delete-service {instance_name}
cf delete-service-key my-logme-service key1
cf delete-service my-logme-service
It may take several minutes to delete the service. Deleting a service deprovisions the corresponding infrastructure resources. Run the cf services command to view the deletion status.
Handle Stack Traces
Java stack traces typically contain multiple lines of content, but Logstash and the Syslog protocol do not support multiline log events out-of-the-box. Instead, they store each line as an individual event in Elasticsearch. Prevent this by encoding the newline character \n as \u2028 (line separator). This enables Syslog and Logstash to read the stack trace as one log event, but is converted to newline when saving it to Elasticsearch.
Adjust the logging configuration of your application to use the encoded newline character \u2028 instead of the default \n line separator.
Examples for Java Spring Configuration
This section shows how to configure the logging settings for multiline log events using the application properties or YAML/XML files.
Add the following snippet to the application's logging configuration:
%replace(%xException){'\n','\u2028'}%nopex
This snippet converts every occurrence of \n in the stack trace to \u2028 (line separator) and filters the original text from the log using the %nopex pattern.
Example Configuration in application.properties
In this example the logging.pattern.console property in the application.properties file is set to log the date, time and log message followed by a newline character as shown below.
Encode linebreaks inside exception messages by adding the given snippet in front of the newline character. This applies the encoding to stack traces of exceptions, but leaves other log events unmodified.
logging.pattern.console=%d{yyyy-MM-dd HH:mm:ss} - %msg%n
logging.pattern.console=%d{yyyy-MM-dd HH:mm:ss} - %msg%replace(%xException){'\n','\u2028'}%nopex%n
Example Configuration in logback-spring.xml
In this example the pattern property in the STDOUT section is set to log the date, time and log message followed by a newline character as shown below.
Encode line breaks inside exception messages by adding the given snippet in front of the newline character. This applies the encoding to stack traces of exceptions, but leaves other log events unmodified.
<configuration>
  <appender name="STDOUT" class="ch.qos.logback.core.ConsoleAppender">
    <encoder>
      <pattern>%d{yyyy-MM-dd HH:mm:ss} - %msg%n</pattern>
    </encoder>
  </appender>
  <root level="debug">
    <appender-ref ref="STDOUT" />
  </root>
</configuration>
<configuration>
  <appender name="STDOUT" class="ch.qos.logback.core.ConsoleAppender">
    <encoder>
      <pattern>%d{yyyy-MM-dd HH:mm:ss} - %msg%replace(%xException){'\n','\u2028'}%nopex%n</pattern>
    </encoder>
  </appender>
  <root level="debug">
    <appender-ref ref="STDOUT" />
  </root>
</configuration>
In contrast to the application.properties, XML/YAML configuration is defined per class. Therefore this snippet must be added for every class that logs exceptions to STDOUT. Any logging configuration that supports the format %replace(%xException){'\n','\u2028'}%nopex can be configured accordingly.
Except where otherwise noted, content on this site is licensed under the Development License Agreement.