Using IIoT Dashboard nodes
Example scenario
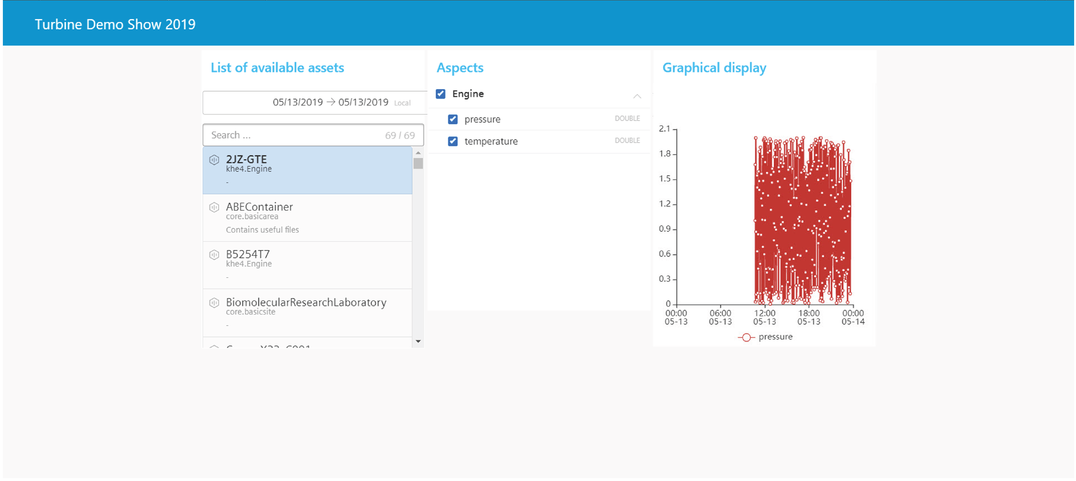
An event needs to be organized in Berlin. The event is a demo show on turbo engines of Siemens. It is required to design an event flow to integrate to the event management application.
Objective
To display the data of an asset for a date range.
Requirements
- A timestamp input
- IIoT date picker node
- IIoT asset list node
- IIoT aspect selector node
- IIoT TS chart node
- Message payload
Procedure
-
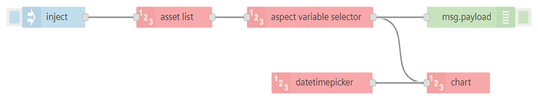
Design the event flow as shown below:

-
Configure the tabs in groups:
- IIoT date picker node
- IIoT asset list node
- IIoT aspect selector node
- IIoT TS chart node
- IIoT map To understand group and tabs configuration, refer to Dashboard working layouts.
-
Swap, shift and configure groups and tabs from the sidebar "Dashboard" window under "Layout" according to the requirements.
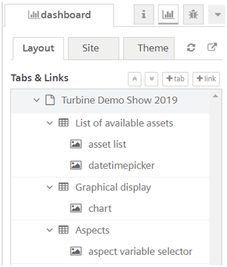
For more information, refer to Dashboard layouts.
-
Save the flow.
Result 1
Click  in Visual Flow Creator application, and select "Open dashboard" to view the flow in Visual Flow Creator dashboard.
You will get a flow as designed:
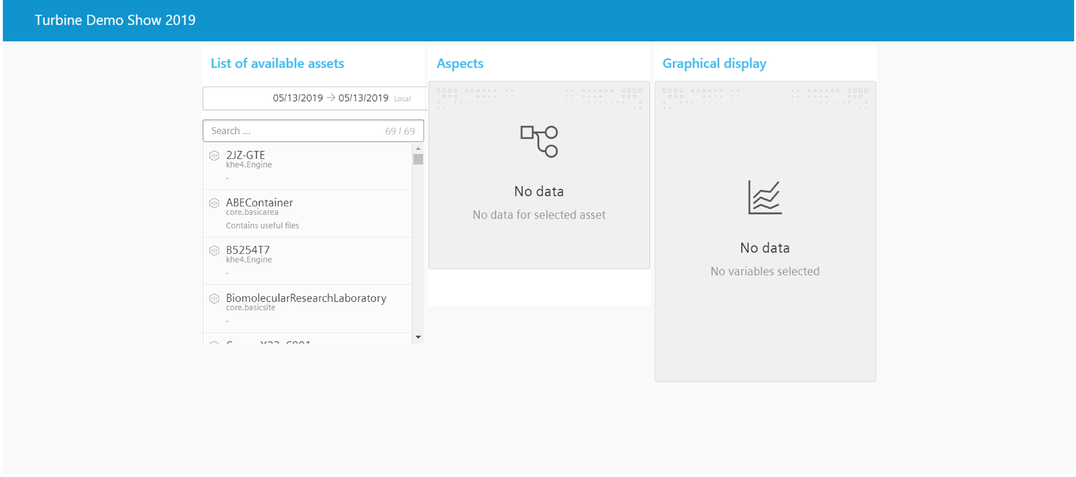
Select an asset, an aspect/(s) and the time range. You will be the data analysis in the chart and the asset location:

Result 2
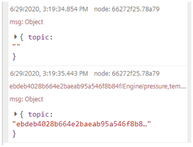
Connect a time stamp and a message payload as shown below with the selected asset, aspect and date range as shown in Result 1:
Node flow design:
Flow in dashboard:
The required information will be displayed in the message payload: