Introduction to Visual Flow Creator
System Manual  
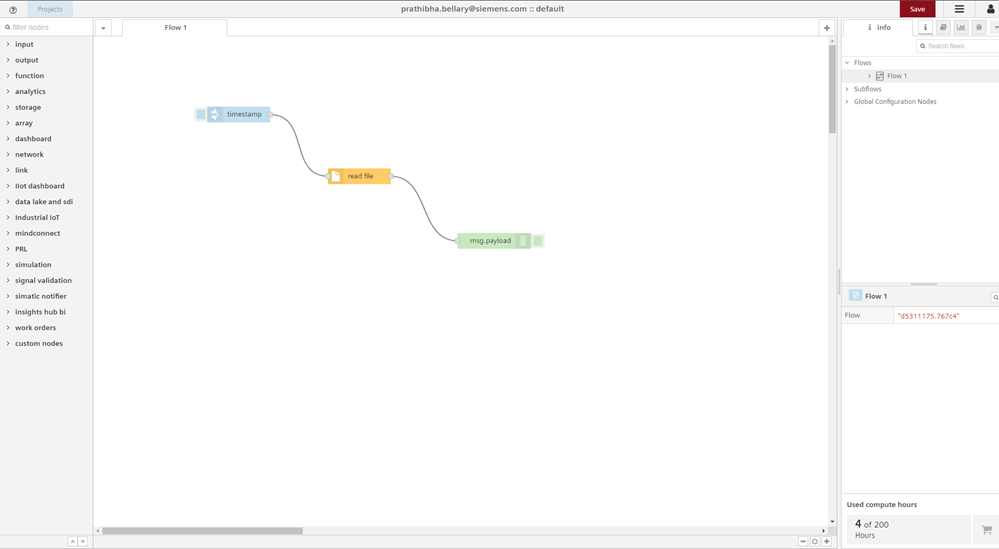
Visual Flow Creator is an application used to create a visual representation of data processing workflows.
Visual Flow Creator is a component in Industrial IoT. For more information, refer to Additional information.
Visual Flow Creator is a software for visual data flow programming in IoT (Internet of Things). Nodes are predefined blocks of functionality. You can interlink and add nodes in the working area and combine them to produce a "flow". For more information, refer to Create flows.
With Visual Flow Creator, IoT applications can be easily implemented in a short amount of time. The focus is on development of prototypes. The graphical user interface also makes it easier to get started with IoT programming. Knowledge of JavaScript is advantageous for the use of Visual Flow Creator.
Visual Flow Creator provides the following functionalities:
Easily access data by using Industrial IoT nodes
- Data flow processing
- Creating own evaluations with Industrial IoT data
- Preparing collected data
- Calculating KPIs
- Creating REST APIs
- Establishing a link to multiple apps
- Creating custom rules
- Triggering notifications at certain events
- Creating simple dashboards
- Inserting own JavaScript code in "functions" nodes. For more information, refer to Function node library.
Data processing in Visual Flow Creator
- Users of Visual Flow Creator are responsible for checking all external resources and sources.
- Visual Flow Creator is suitable only to a limited extent for processing of continuous information.
- Error-free execution of flows is dependent on the Industrial IoT services.
Additional information
You can find additional information about VFC using the following links:
- Visual Flow Creator examples: vfc-examples.
- Visual Flow Creator tutorial: VFC Introduction.
You can find additional information about Node-RED using the following links: