Implement IIoT Map node - Example
Example scenario
Create a flow with Map node.
Objective
To view the map in the Visual Flow Creator Dashboard with given coordinates.
Procedure
-
Design the event flow as shown below:
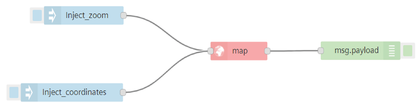
-
Configure the group in tab:
- IIoT map node
- Edit IIoT map node properties:
- Group: Location [IIoT Map]
- Label: map
- Longitude: 8.352164
- Latitude: 49.027324
- Zoom level: 15
Note
- To drag the map in the dashboard, check "Draggable".
- To set the coordinates to current location, click "Use current location".
4.Save the flow.
Result 1
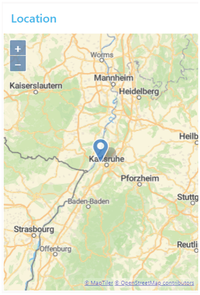
Open the dashboard to display the result as per the coordinates set in IIoT map node:

Change zoom level using inject node
Edit the "Inject_zoom" node property and enter the below JSON code to change the zoom level:
    {

        "zoomLevel": 8

    }
Save the flow.
Result 2
Open the dashboard to display the result as per the zoom level set in Inject_zoom node:
Change zoom level and coordinates using inject node
Edit the "Inject_coordinates" node property and enter the below JSON code to change the zoom level and coordinates:
    {
        "latitude": -30,
        "longitude": 20,
        "zoomLevel": 5
    }
Save the flow.
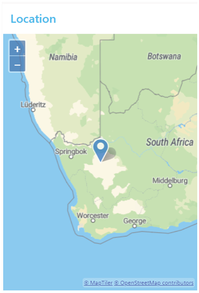
Result 3
Open the dashboard to display the result as per the zoom level and coordinates set in Inject_coordinates node:
Last update: January 22, 2024