Viewing Metric usage data
Metric usage data of an application can be viewed as an application operator and application consumer (IoT, Premium, Base and Mendix tenants).
The following screenshot displays the metric usage data of the application.
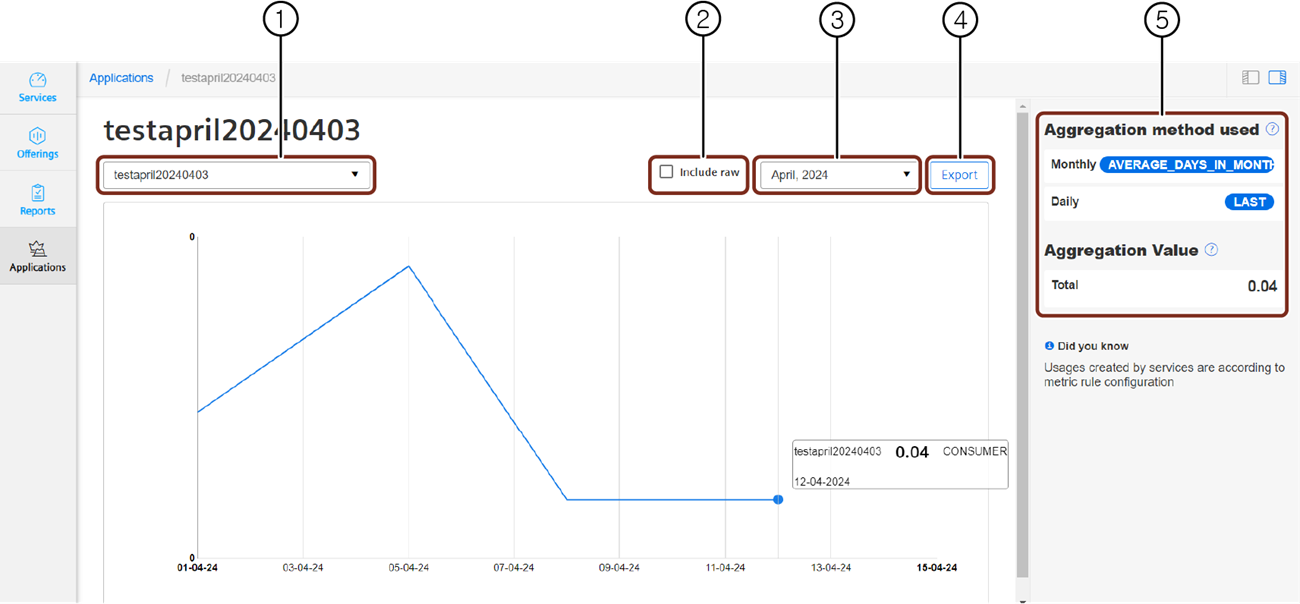
① List of all the provisioned tenants
② Checkbox to include the raw data
③ Month picker to select the required month
④ Export option to download the .csv report
⑤ Aggregated method used and aggregated value of the tenant
Application operator
To view the metric usage data as an application operator, follow these steps:
- In the navigation pane, click "Operator" from "Applications".
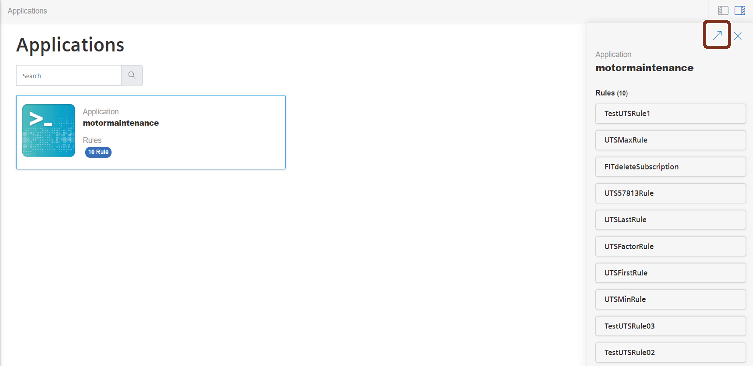
The "Operator" section appears with a list of applications hosted in the tenant. - Select the application and click
 in the preview section. Or In the search box, enter the application name, select it, and click .
 - Select the rule and click .
- Click "See Usages".

The list of all the provisioned tenants are displayed.
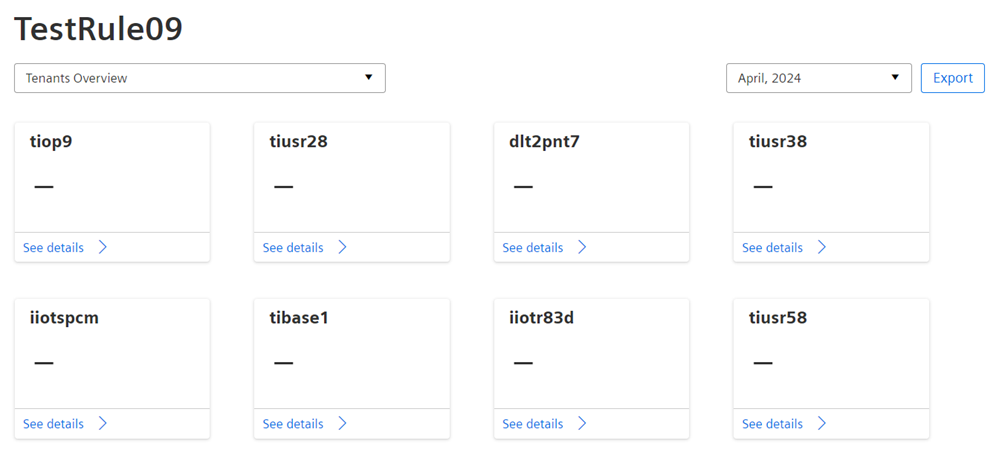
- Select the required month.
For more information on the monthly usage report of the application consumer, refer to Export report for application operator section. - Select the tenant and click "See details".
The graph with the metric usage details will be shown.
It is only possible to view the metric usage graph for the latest 3 months.
Note
It takes up to 36 hours for the latest usage data to be displayed on the graph. The data upto latest 3 months will be displayed on the graph. For data older than 3 months, raise the download request to download the data.
Application Consumer
To view the metric usage data as an application consumer, follow these steps:
- In the navigation pane, click "Consumer" from "Applications".
The "Consumer" section appears with a list of applications hosted in the tenant. - Select the application and click in the preview section.
Or
In the search box, enter the application name, select it and click.
The list of provisioned metric units (rules) are displayed.
- Select the required metric unit.
- Select the required month and click "See details".
The graph with the metric usage details will be shown.
It is only possible to view the metric usage graph for the latest 3 months.
Note
Once the usage data is submitted to UTS, it takes up to 36 hours for the usage data to be displayed on the graph. The data upto latest 3 months will be displayed on the graph. For data older than 3 months, raise the download request to download the data.