Viewing metric status for the subscribers of MindAccess Plans
To view the metric status of the tenant, in the navigation pane, click "Services".
In the "Services" tab, purchased limits and used limits of all the metrics are displayed. Each metric name is followed by its measurement unit displayed in parentheses.
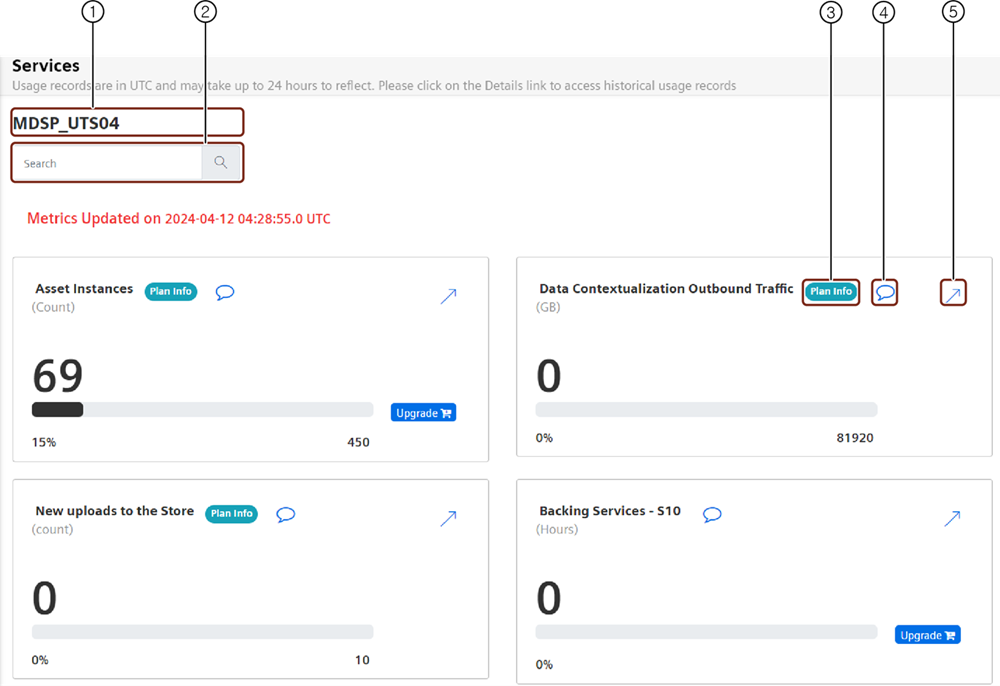
① Search field
② "Plan Info" button shows limits and usage details of the plans and the metrics
③ You can add a comment for later reference
④ Displays the historic data of the metric
Note
- "Time series data ingest rate" metric is displayed for both tenant and asset with the update cycle of 15 minutes and has a 35 minutes delay. For example, data from 10:45 will be available at 11:20.
- "Time series data ingest rate per asset" provides the metric details in a table containing "Asset Name", "Asset Id", "Data Ingest", "Unit" details.
- It is possible to view the hourly data in the Services Dashboard. Currently, only the hourly data of Timeseries Ingest metric is shown on the Services dashboard.
- For the migration of legacy Insights Hub customers to a new offering structure, the Asset-Attribute parameter is crucial. Hence the Asset-Attribute metric is displayed on all the legacy tenants without impacting the ongoing plan or the billing.
For more information on our new offerings, please visit Insights Hub Store or connect with your Insights Hub Sales partner”.
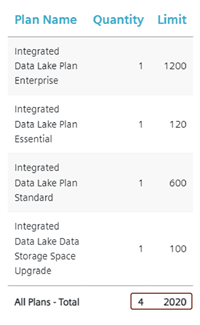
Plan info
The "Plan info" button displays the individual offering's limits and quantity information of each metrics. The details of "Quantity" and "Limit" for each offering of the chosen metrics are displayed in this section. The total value of the plan as a whole is calculated by multiplying the quantity and the limit value of each offering.
In the example shown below, the metric has three offerings with 4,7,3 units of quantities and 100,0,1000 units of limits respectively. The Total value is calculated by adding the multiplied values of quantity and limits from each offering (4*100+7*0+3*1000).
Purchasing upgrades
You can purchase upgrade for the following metrics:
- Asset Types
- Asset Instances
- Users
- Subtenants
- Rules Quota
- Timeseries Storage
- Insights Hub Business Intelligence Viewer Users
- Insights Hub Business Intelligence Creator Users
- VFC Compute Hours
To purchase an upgrade for a metric, follow these steps:
- In the navigation pane, click "Services".
- Click "Upgrade" for the metric you want to upgrade. You are directed to the "Upgrade" application.
- Purchase the upgrade. For more information, refer to Upgrade manual.
After the purchase, click "Back to previous app" to navigate back to the "Usage Transparency" application.
Viewing historic usage status of metrics
The history usage status of the metrics can be viewed either on "Hourly" or "Monthly" basis.
To view the history of usage status of metrics, follow these steps:
- In the navigation pane, click "Services".
- Select the metric of your choice and click

- Select the tenant of your choice.
The metric data for the selected tenant will be displayed. - Select "Hourly" or "Monthly" as per the requirement.
The purchased limits and used limits of all the metrics with the hourly or monthly data of the tenant are displayed as per the selection. Each metric name is followed by its measurement unit displayed in parentheses. - To view the status of metrics for a specific month, select the month of your choice in the month picker drop down.
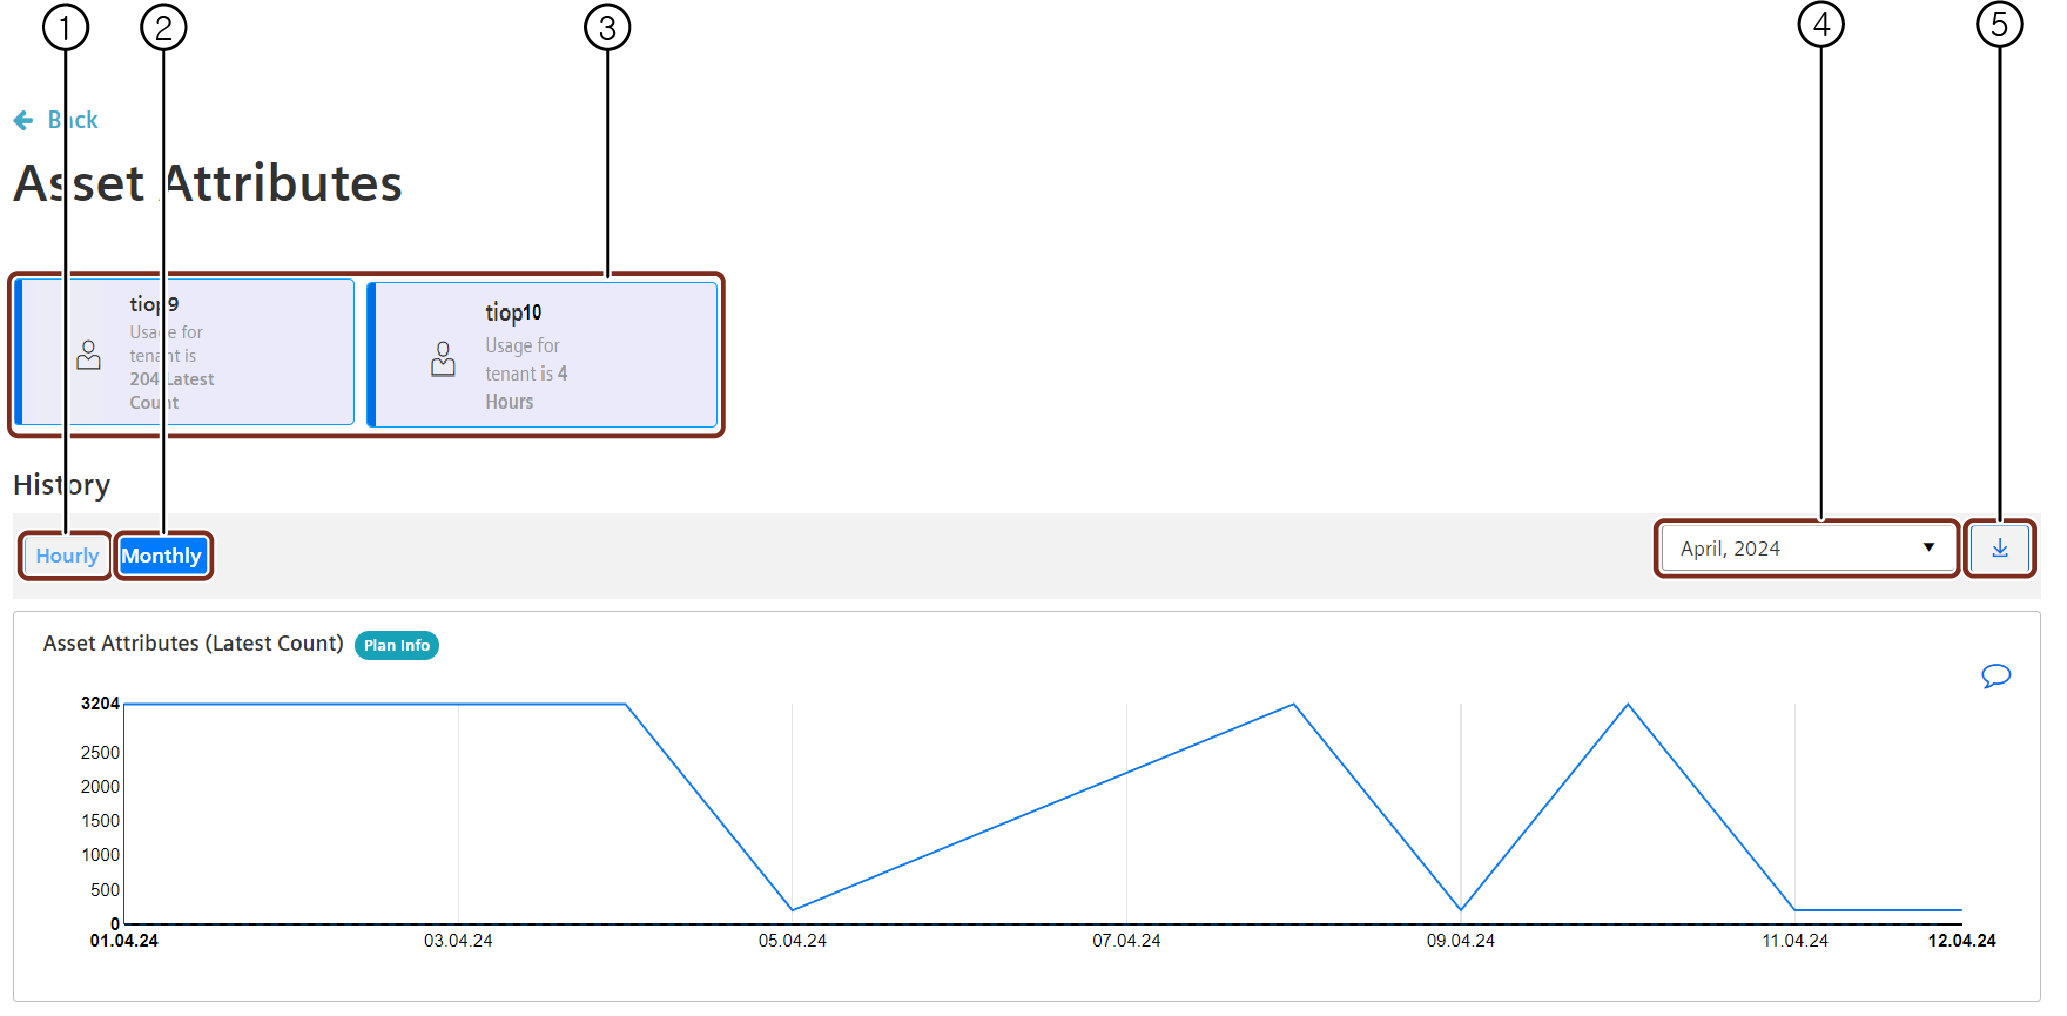
① Displays the Hourly data of the metric
② Displays the monthly data of the metric
③ List of all the tenants with the consumption data of the selected metric
④ Month picker to select the required month
⑤ "Export" button creates a .csv file containing the usage status data
Note
- Daily aggregated data of "Time series data ingest rate per asset" is available for the last 3 months and up to 7 days data can be retrieved at a time with the latest data from the previous day. The data is available only for export.
- Usage Transparency service aggregates the usage data of one hour and displays this usage data with the timestamp of the next hour.
For example: Usage data from 23:00 to 23:59:59 hours of a day will be displayed as 0:00 hours of the next day.
Except where otherwise noted, content on this site is licensed under the Development License Agreement.