Introduction
System Manual  
Usage Transparency provides customers with a user interface that provides transparency and allows them to gain detailed insights into tenant specific consumption data (metrics) and their specific limits or targets of the subscription plans. It brings together various consumption data on the Industrial IoT platform allowing the users to track the metrics that enable their utilization-based pricing models. The dashboards allow the users to access required usage metrics for a specific time period. Also, users can generate usage reports in the .csv file format for further analysis. These reports help the users to track the metrics and make decisions about managing and upgrading their subscription plans.
The following screenshot shows Usage Transparency user interface:
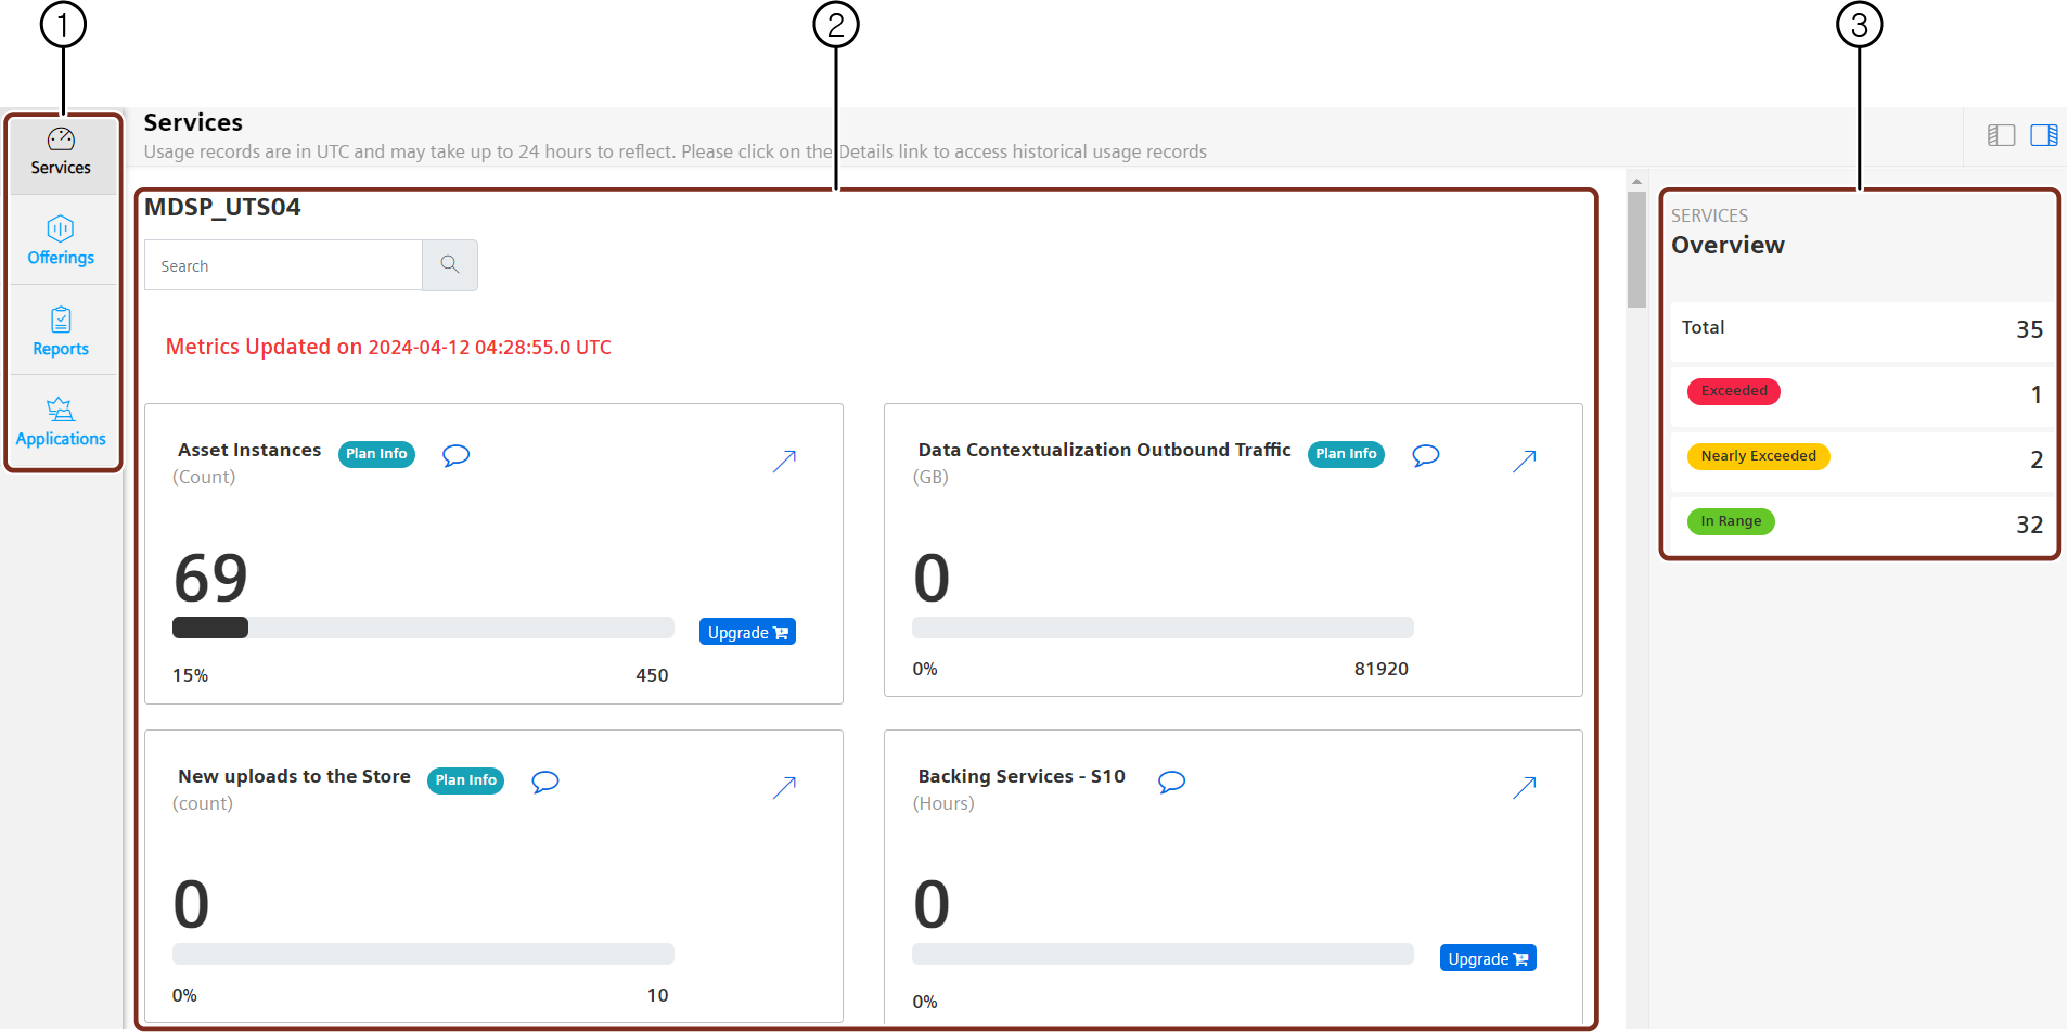
① Navigation pane
② Display area
③ Metric status overview for the tenant
Multilingual support
Usage Transparency User Interface (UI) provides support for English and Chinese languages. To view the UI in Chinese language, change your browser language settings.