Getting Started
Prerequisites
Before starting, please make sure you have:
- Editor/admin access to Next-gen Dashboards
- Some asset data in your current set-up
Note
- Please use either Chrome or Firefox Internet browsers, not Internet Explorer.
- Next-gen Dashboards is not applicable for Private Cloud.
Best Way to Learn
Open another page of Next-gen Dashboards side-by-side with this tutorial so you can try out some steps.
Creating Dashboards
A dashboard gives you an at-a-glance view of your data and lets you track metrics through different visualizations.
Panels
Each panel on a dashboard represents a part of the story you want your dashboard to tell. A panel consists of a:
- Query: defines which data to display
- Visualization: defines how the data displays
The Panel Edit Page
The Panel Edit page displays three tabs on the left:
- Query: where you create the query to pull your data into a Dashboard.
- Visualization: where you can select a visualization panel to show the data. You can also change the visualization settings of the panel.
- General: displays the panel's title and settings, such as if the panel hyperlinks to another dashboard.
How to Create a New Dashboard
Follow these steps to create new dashboard:
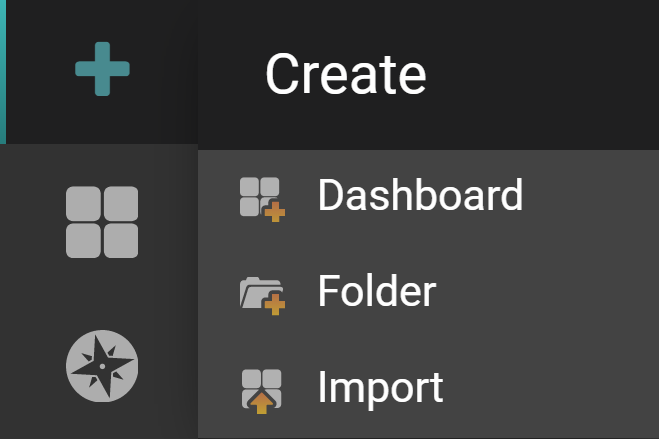
-
Hover over the + button on the side panel, and click "Dashboard" to create a blank dashboard with an empty panel.
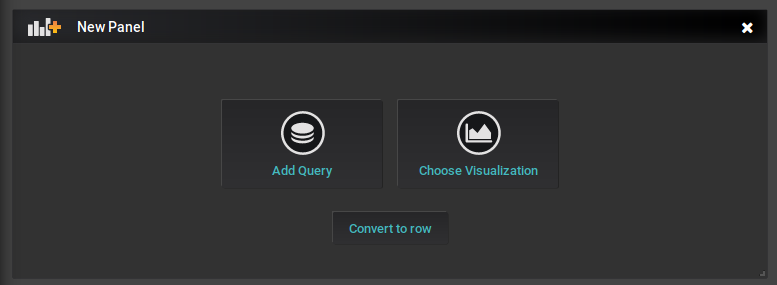
-
Click "Add Query" to open the panel edit page.
- If you have asset data available, you can continue this tutorial with your data; if not, you can use the provided test data.
Getting Your Data into a Next-gen Dashboard
The steps below apply to IoT data. See Using IDL Data Sources in Next-gen Dashboards for information on using Integrated Data Lake (IDL) data.
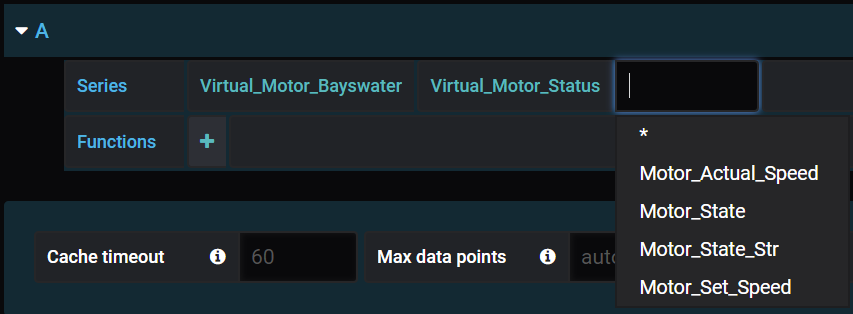
Follow these steps to retrieve your IoT data:
- Click "select metric" or enter an asset name in the search field. Aspects included in the asset display.

- Select an aspect. The aspect's variables display.

- Select a variable.
Info
If no data is available, it's likely that the default time range does not contain data from your asset. Try selecting different time ranges from the time selector drop-down list. If you continue to experience issues in retrieving data, try using the generated test data for the next steps.
Note
Next-gen Dashboards does not support variables assigned directly to asset types.
Connecting to Data
If you are already getting data, skip step 1 below; otherwise, follow these steps to connect data:
-
Select "testData" from the drop-down list. Random data is used by default, but you can use other data scenarios.
-
When your data shows, click the Esc key (or back button) to return to the dashboard page. Your dashboard displays with the new panel.
-
To create another panel, click the "Add panel" button.
Adding a Visualization Panel
Follow these steps to add a visualization panel:
-
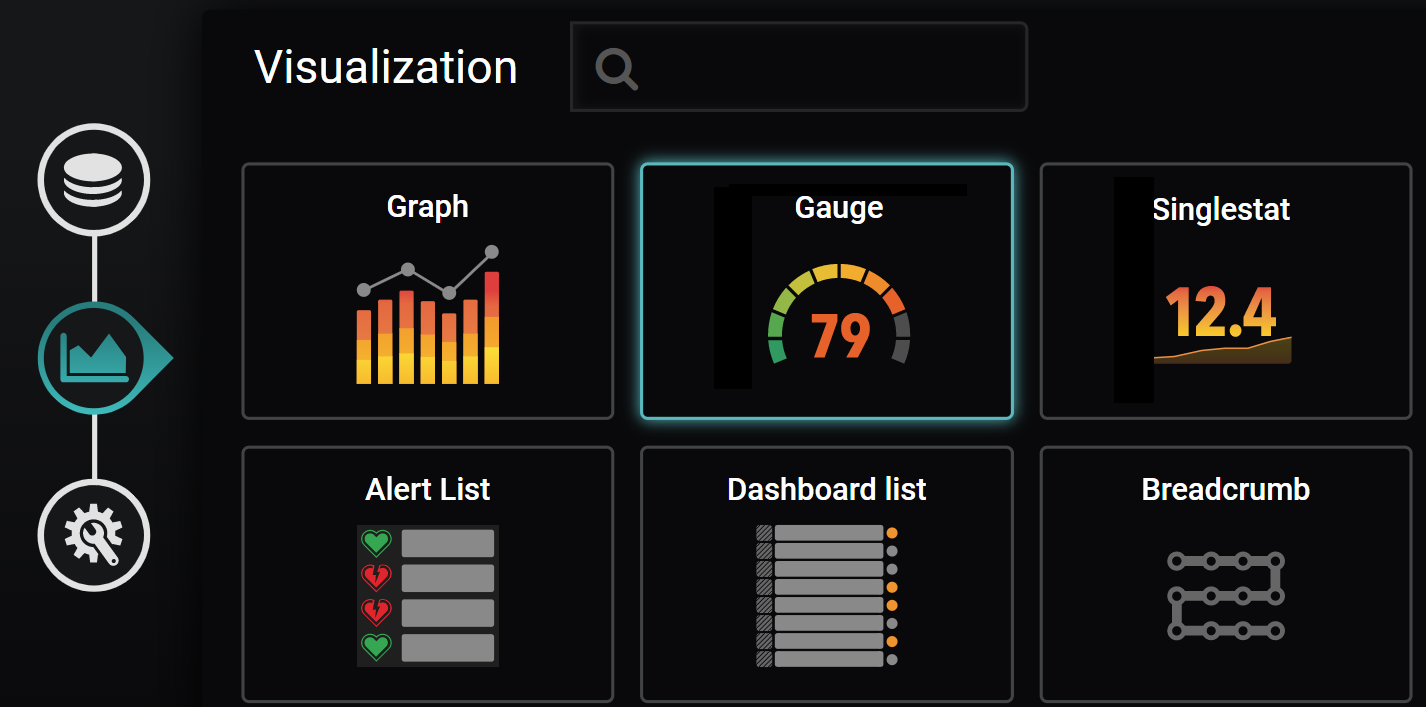
Click the "Choose Visualization" option. The Visualization tab opens under the "Panel edit" page.
-
Click the graph drop-down list and select "Gauge" from the list.
-
Click the "Query" tab.
-
Select some of your data or test data. When the data comes in, press the Esc key or the Back button to go back to the Dashboard page.
-
Duplicate the panel using one of the methods discussed in "Additional Panel Actions", which appears right after the Visualization image below.
Your dashboard should now look similar to this:
Additional Panel Actions
Some additional actions you can take with panels are:
- Resize panel: click and drag the lower right corner of the panel to resize it up or down.
- Duplicate: select "More" from the drop-down list at the top of the panel, then click "Duplicate". Alternatively, you can left-click anywhere on the panel, then press "p" and "d".
After duplicating the panel, we recommend trying a different query so different data displays.
Saving Your Panel(s)
Follow these steps to save your panel:
-
Click anywhere on the panel and press "e" on your keyboard, or click the heading of the panel and select "Edit". The "panel edit" page displays.
-
Navigate to the "General" tab, and enter a name for the panel. Repeat as needed for other panels in your dashboard.
Saving Your Dashboard
Follow these steps to save your dashboard:
-
Click the 'save disc' icon in the top right corner of the dashboard. The save dialog displays.
-
Enter a name for the dashboard.
-
Select (optional) a folder to store the dashboard.