Configuring diagnostic settings
Diagnostic Settings
This section contains the configurations related with logging. To perform a diagnostic settings change, follow these steps:
- In "Asset" tab, select the asset.
- Open MindConnect plugin.
- Click
 , next to "Onboarding Status".
 -
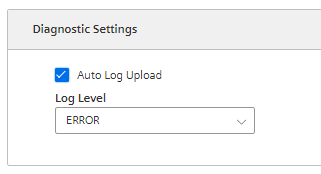
In “Diagnostic Settings” section, make the changes in Auto Log Upload or Log Level.
-
Click “Save”.
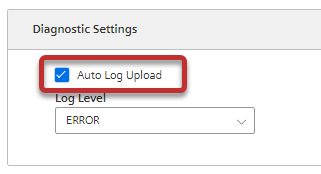
Auto Log Upload
If Auto Log Upload is enabled, the device uploads all the generated logs to Insights Hub periodically. Log upload functionality for the device is enabled by default.
Note
In case the user does not wish to upload logs the checkmark can be unchecked and no logs would be uploaded further.
Log Levels
Log level represents the log level of MindConnect device. There are five possible log levels, and the hierarchy is as follows in lowest (TRACE) to highest (ERROR) priority. In “TRACE” mode, the device will log extensively and in “ERROR” mode device will only log error messages.
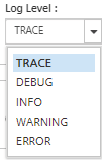
The selected log level and logging mechanism works as logging only selected level and the higher levels.
Log level is set to “INFO” by default.
Auto Log Level Change
- “TRACE/DEBUG” log levels provide more verbose logs which will be helpful to troubleshoot issues, however they produce more files. If the log level is set to “TRACE/DEBUG”. It will be automatically changed to INFO after one day.
- Auto log level change operation will not be synchronized with the asset’s device configuration.
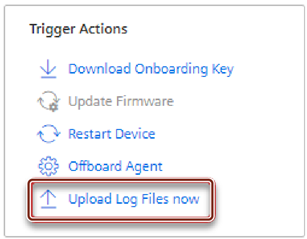
Upload Logs Now
If you click “Upload Logs Now”, the device immediately uploads latest logs to Insights Hub regardless Auto Log Upload status. It can be used for troubleshooting purposes.
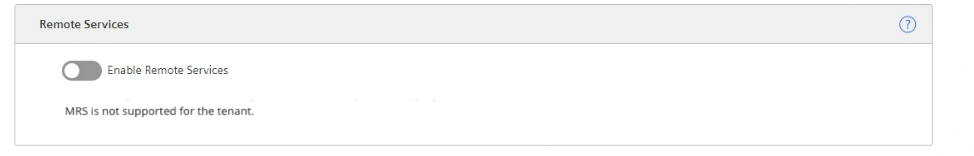
Remote Services Integration
The integration of Remote Services to MindConnect Nano aims to provide solution for accessing factory related device via Nano. There are plenty of different services and protocols offered by RS to connect to the field devices and data. For more information on RS application, refer to Remote Services documentation.
To integrate RS application with MindConnect Nano, follow these steps:
- Create asset.
Note
To create an asset, see Creating an asset for MindConnect Nano.
2.Onboard agent.
Note
To onboard an agent, see Overview of onboarding MindConnect Nano.
3.Link asset id with RS application.
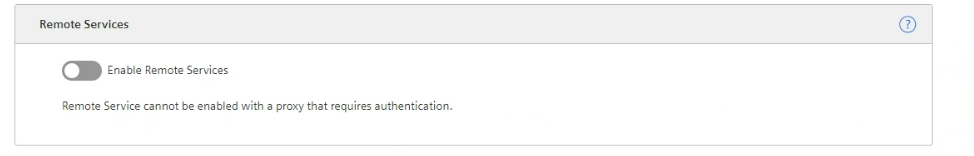
4.Enable RS Services on the agent using toggle button and configure use cases in RS applications.
5.Click "Save".
Warning
- Be aware that enabling RS application might effect on the time-series data transfer. Ensure that MindConnect Nano is able to perform operations smoothly via Insights Hub Monitor occasionally.
- RS Application does not support proxy authentication, thus enabling the proxy authentication will disable the RS application if it is enabled.
Note
- Starting or stopping RS application is an asynchronous task, during this ongoing phase the toggle on or off operations will be neglected.
- RS application itself has a separate management system of devices, the user needs to create a device on RS application and associate it with MindConnect Nano’s asset via their id’s. Thereafter, user can able to enable the application from the MindConnect element UI.
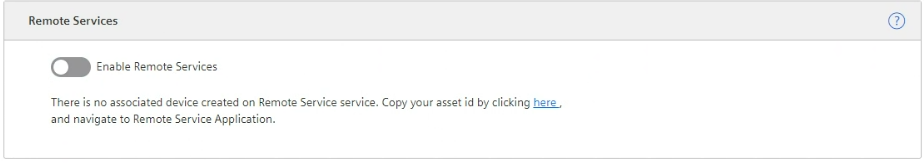
- If the RS application is not provisioned for the customer environment then the user will not be able to enable the application and will see the below message on MindConnect element UI. To provision the application contact Support Team.