Diagnosing MindConnect IoT2050
MindConnect IoT2050 web UI provides a diagnosis tab to display diagnosis messages and download diagnosis, log and system files.
Diagnosis area
In the navigation menu, you can click "Diagnosis" to open diagnosis page. It provides following features:
- Diagnosis messages
- Diagnosis files
- Network analysis
Diagnosis messages
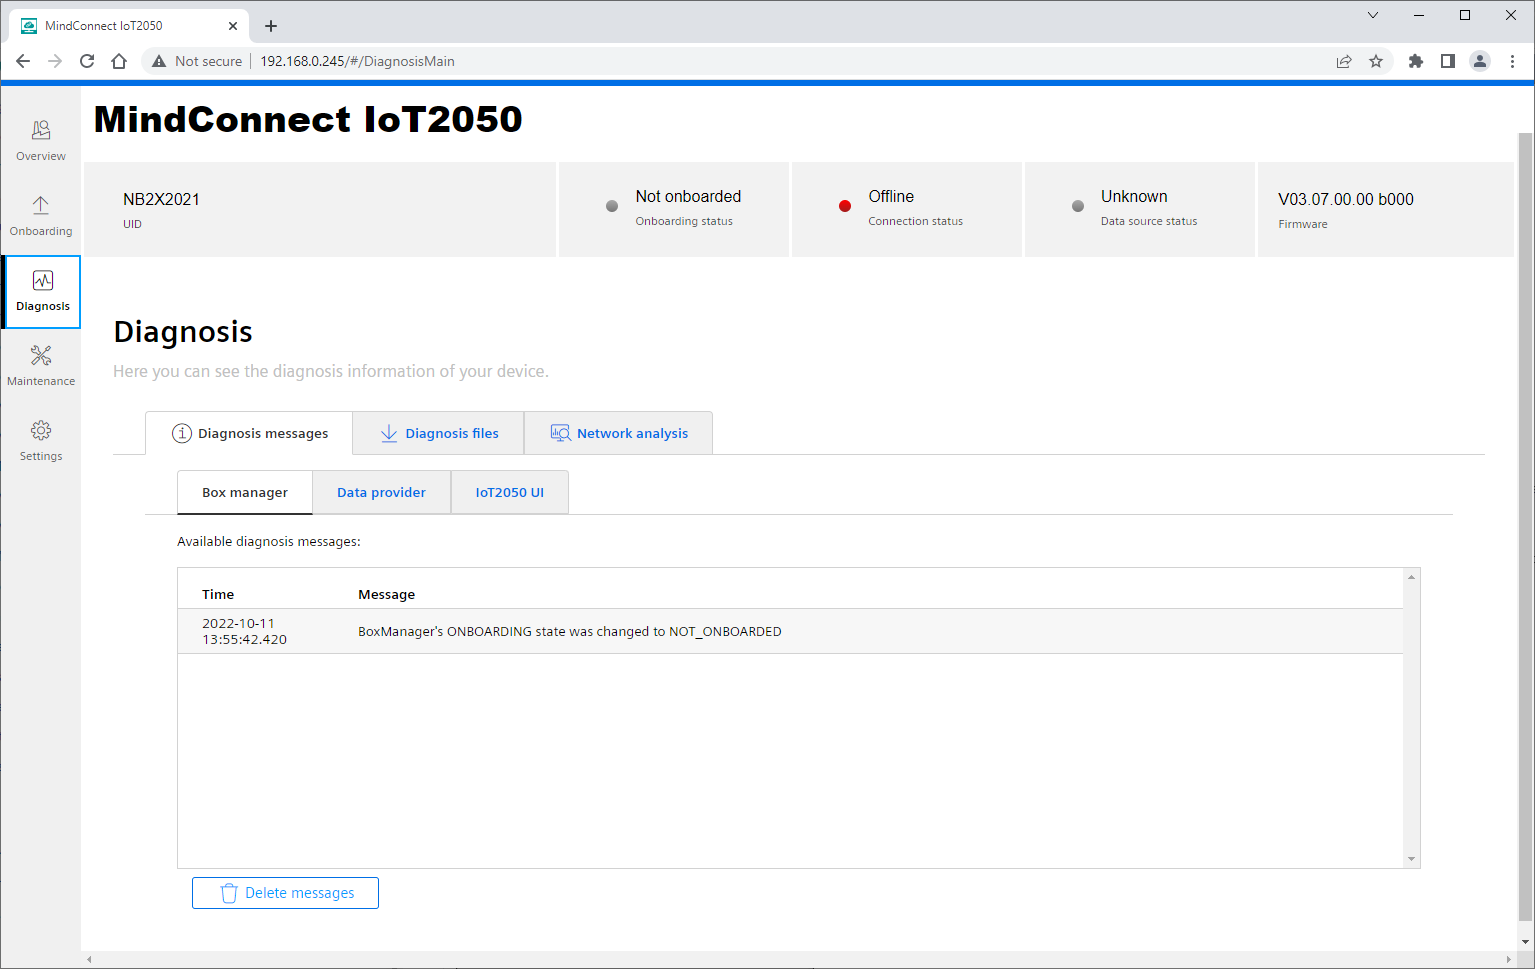
The "Diagnosis messages" section provides a list of currently stored diagnosis messages in the web UI of the following components in separate sub-tabs:
- Box manager: Shows current states like onboarding, network connection, or data source connection states.
- Data provider: Shows diagnosis messages of Modbus TCP, Rockwell and system information data sources.
- IoT2050 UI: Shows diagnosis information of MindConnect IoT2050 UI. Currently unexpected errors and cloud connection check related messages will be displayed.
In “Diagnosis messages” section, the last diagnosis message will be displayed. You can download the previous diagnosis messages from the “Diagnosis files” section.
If the diagnosis messages section is open for a long time, the last 50 diagnosis messages will be displayed.
With the "Delete messages" button, the internal buffer of the currently visible component's diagnosis buffer will be deleted.
Diagnosis files
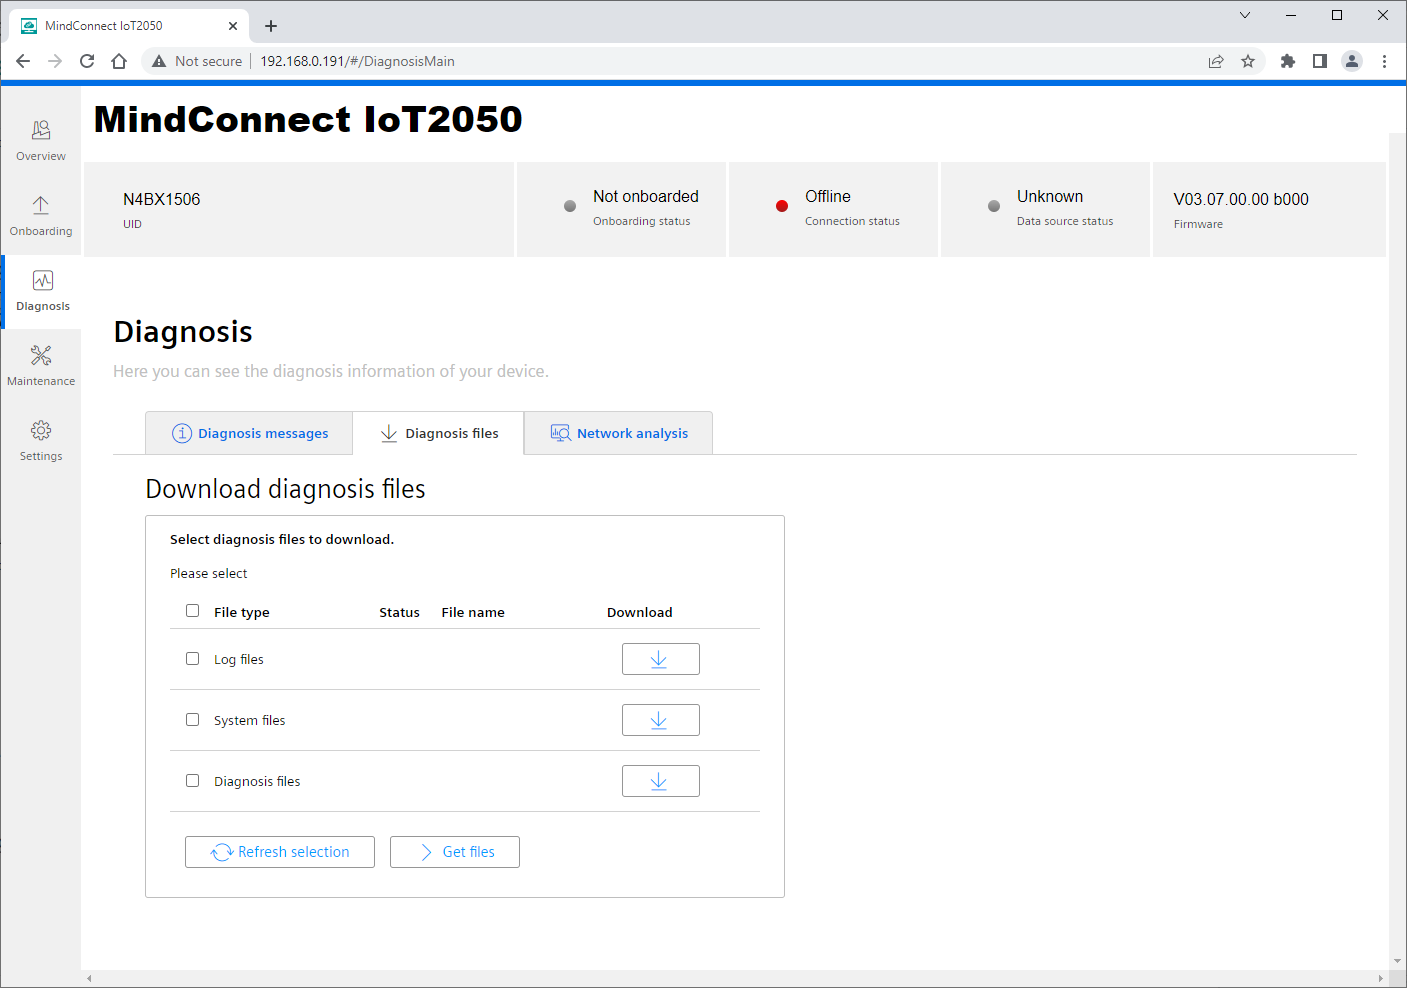
In “Diagnosis files” section, you can download the following kind of diagnosis files:
- Log files
- System files
- Diagnostic files
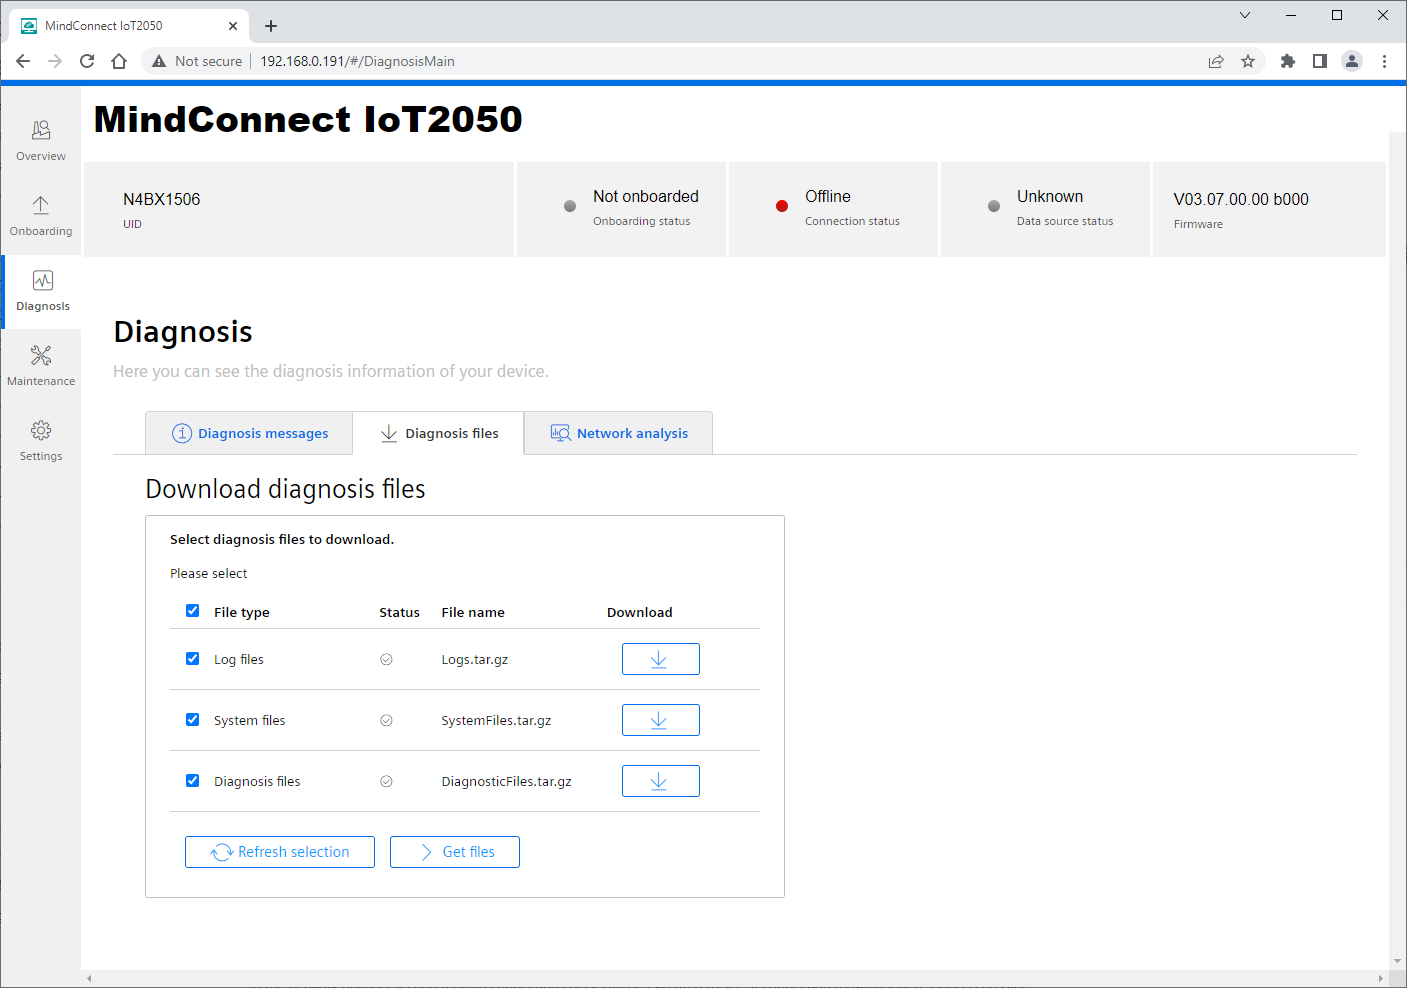
To download the diagnosis files, select the checkbox. Thereafter, click "Get files" button to start the collection and preparation process. When the preparation process completed, the download buttons will be enabled, and you can the download the created diagnosis file packages by clicking download buttons.
Note
If the files are not downloaded by the browser, check the download is blocked by the browser and enable the download for MindConnect IoT2050.
Network analysis
Cloud connection check
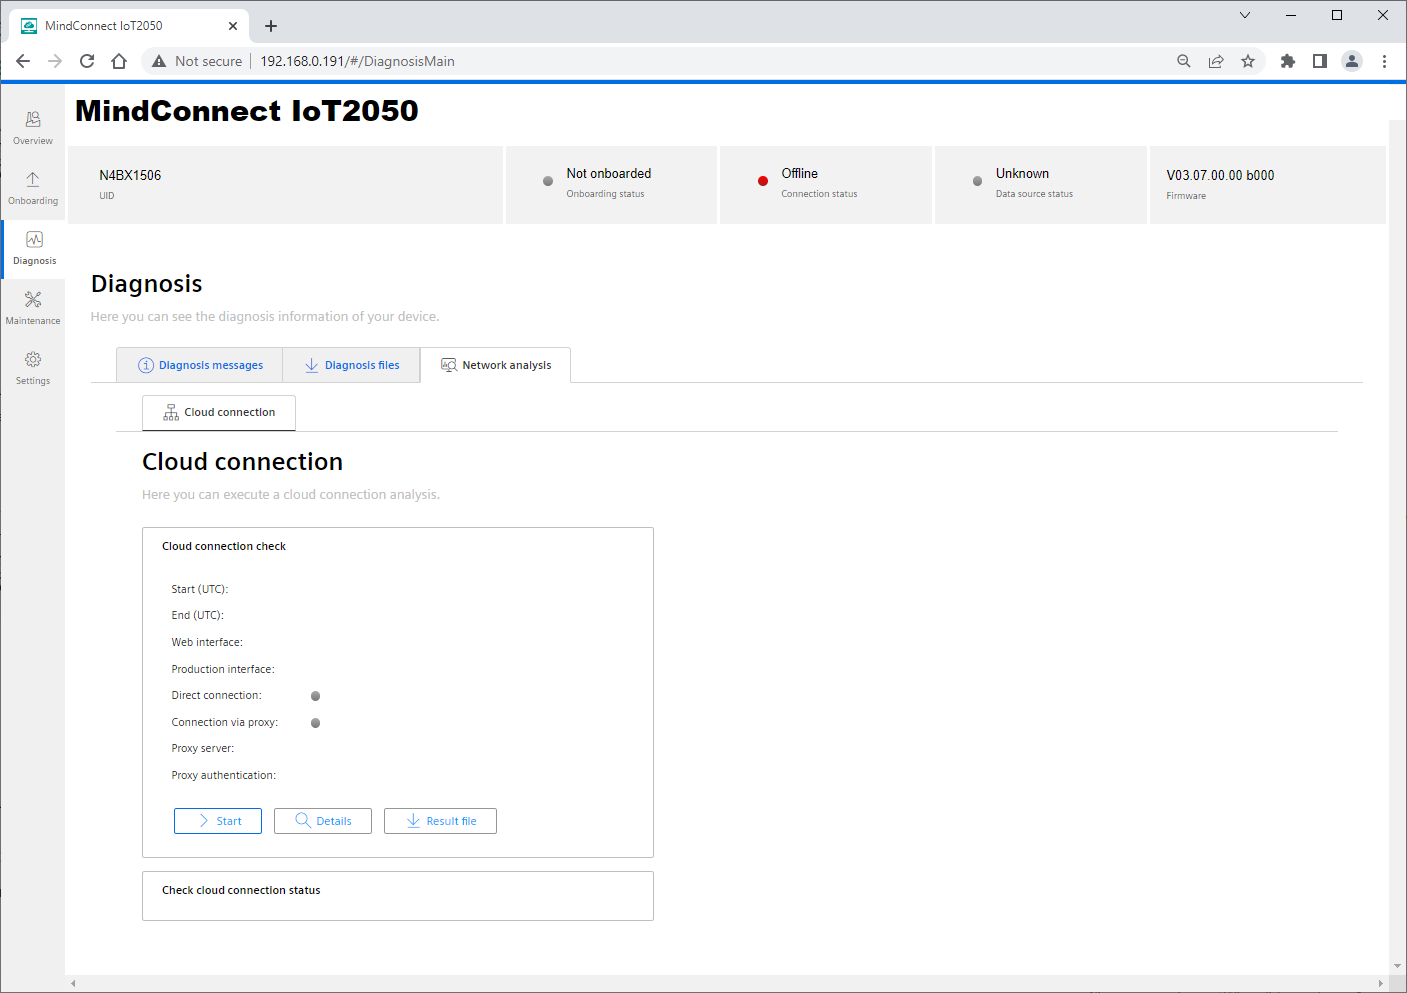
In “Network Analysis” section, a cloud connection check can be executed to verify the connection to Industrial IoT cloud is possible. By clicking the "Start" button an automatic cloud connection check will be executed by MindConnect IoT2050.
After the test has been executed the following test results will be shown:
- Start and end time of the test in UTC format.
- Current IP addresses of web and production interfaces.
- Result of direct connection test.
- Result of connection test via proxy server if the proxy server is configured in Asset Manager.
- Proxy server and proxy authentication info if they are configured in Asset Manager.
After clicking the "Details" button the result log of the executed cloud connection check will be shown in a dialog. The result log can also be downloaded as a file by clicking the "Result file" button.
Cloud connection check status
The current status and the final status at the end of the command execution will be shown in the cloud connection check status area.
In the diagnosis messages section, cloud connection status messages are also available in "IoT2050 UI" tab.
Note
It might be possible that the execution of the cloud connection check will take some time depending on the current network configuration.