Loss Overview
The Loss Overview page shows the Total Effective Equipment Performance (TEEP) and loss distribution for the selected line or asset.
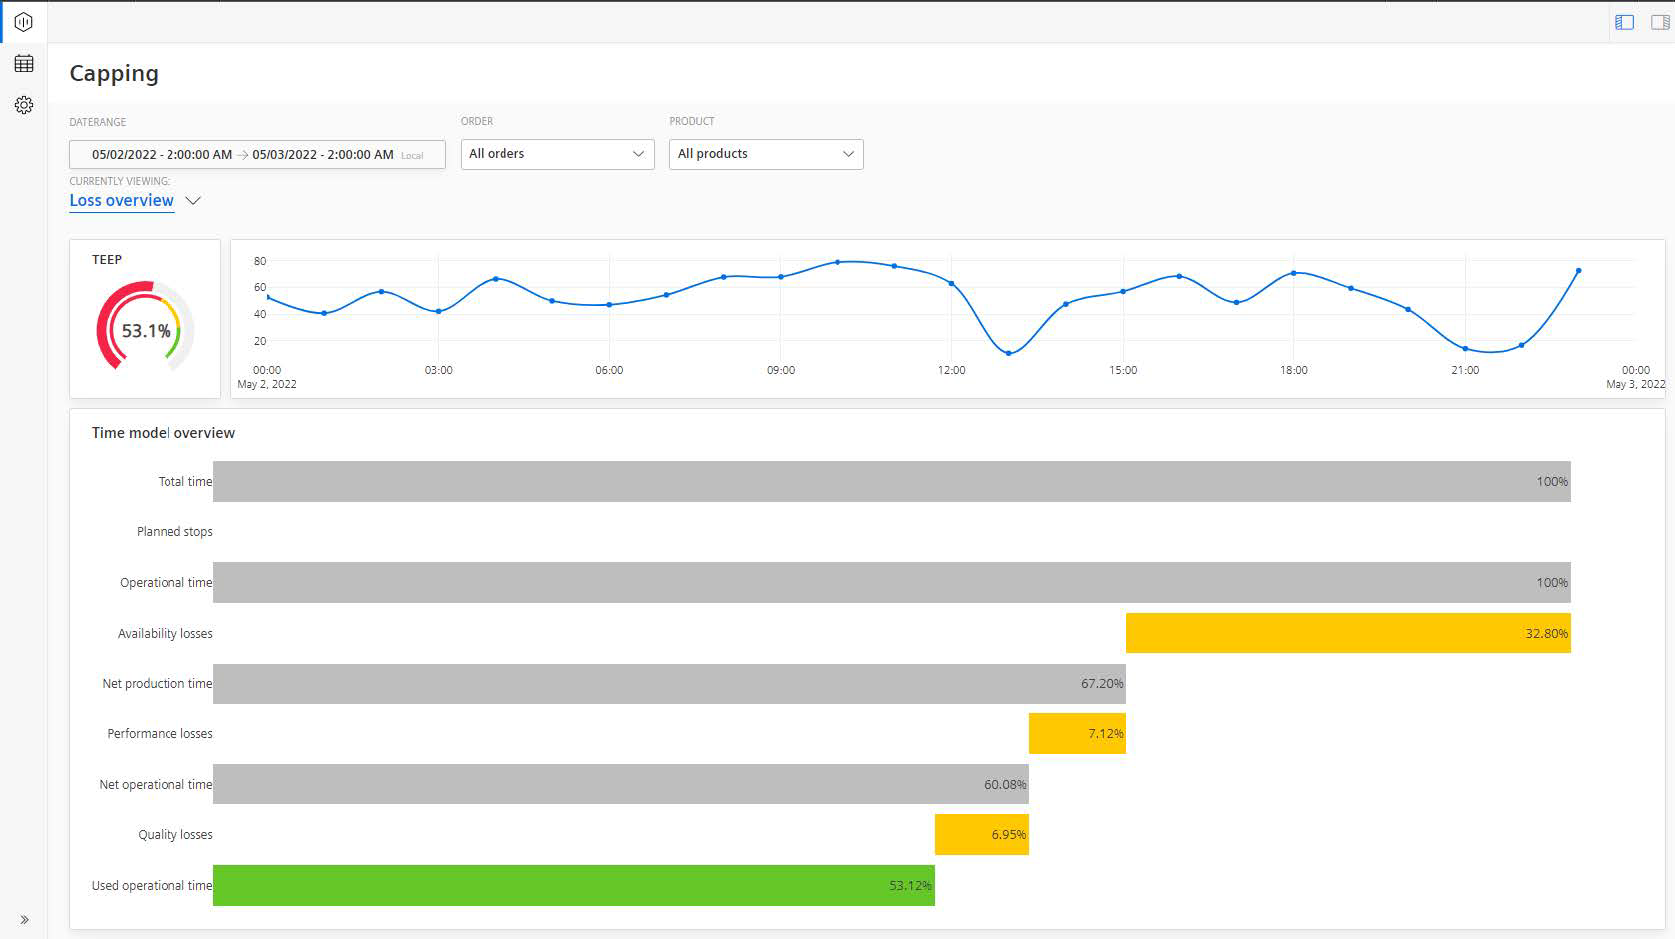
In this section, the following parameters are displayed:
-
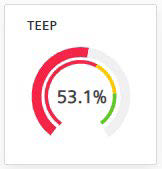
A semi-donut chart that shows the Machine TEEP. The KPI is calculated based on the machine inputs. Depending on the configured limits for Error, Warning, and Success they are colored in Red, Yellow, and Green respectively.
-
A line-plot chart shows machine TEEP calculated based on the percentage of progress over time.
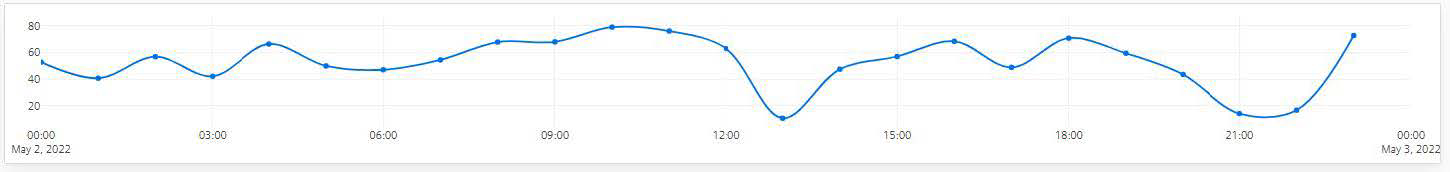
For other functionalities to explore the chart further, see section Visualization pane.
-
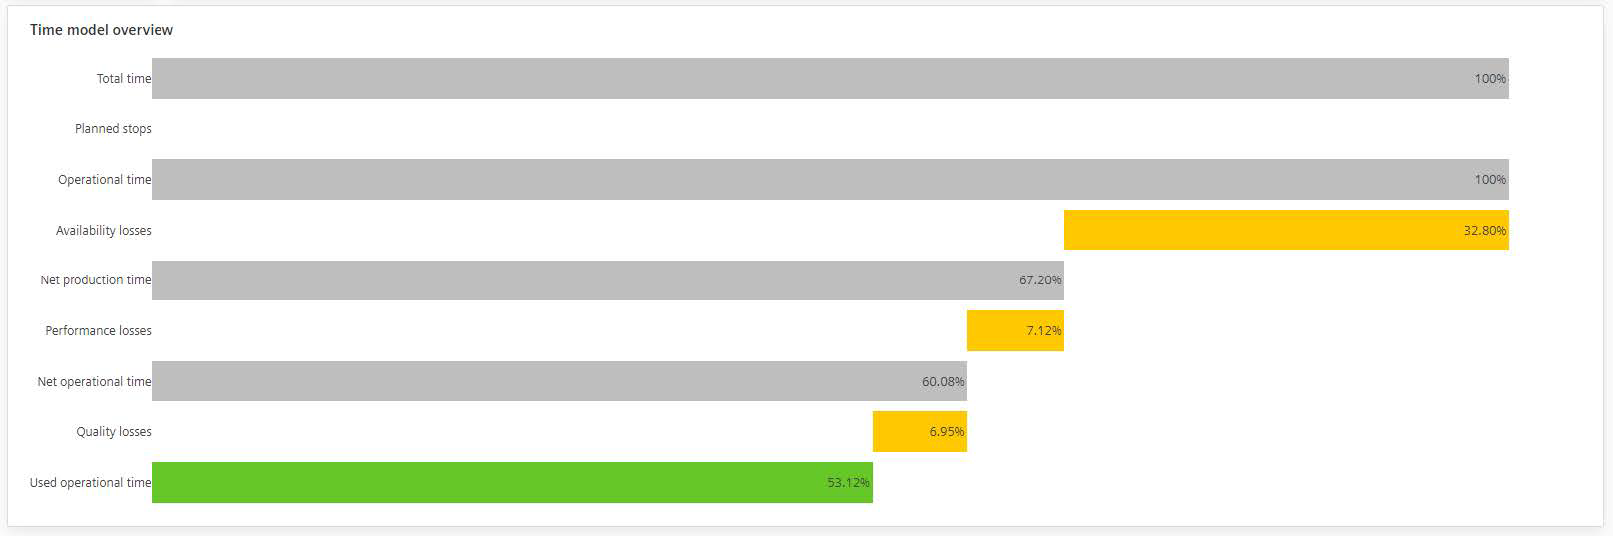
The Time model overview chart shows the loss distribution for the following parameters. Refer to the Configuring KPIs Section to see how each KPIs are calculated.
- Total time
- Planned stops
- Operational time
- Availability losses
- Net production time
- Performance losses
- Net operational time
- Quality losses
- Used operational time