Configuring Lines
User interface
In “Machines and Lines”, you can perform the following actions:
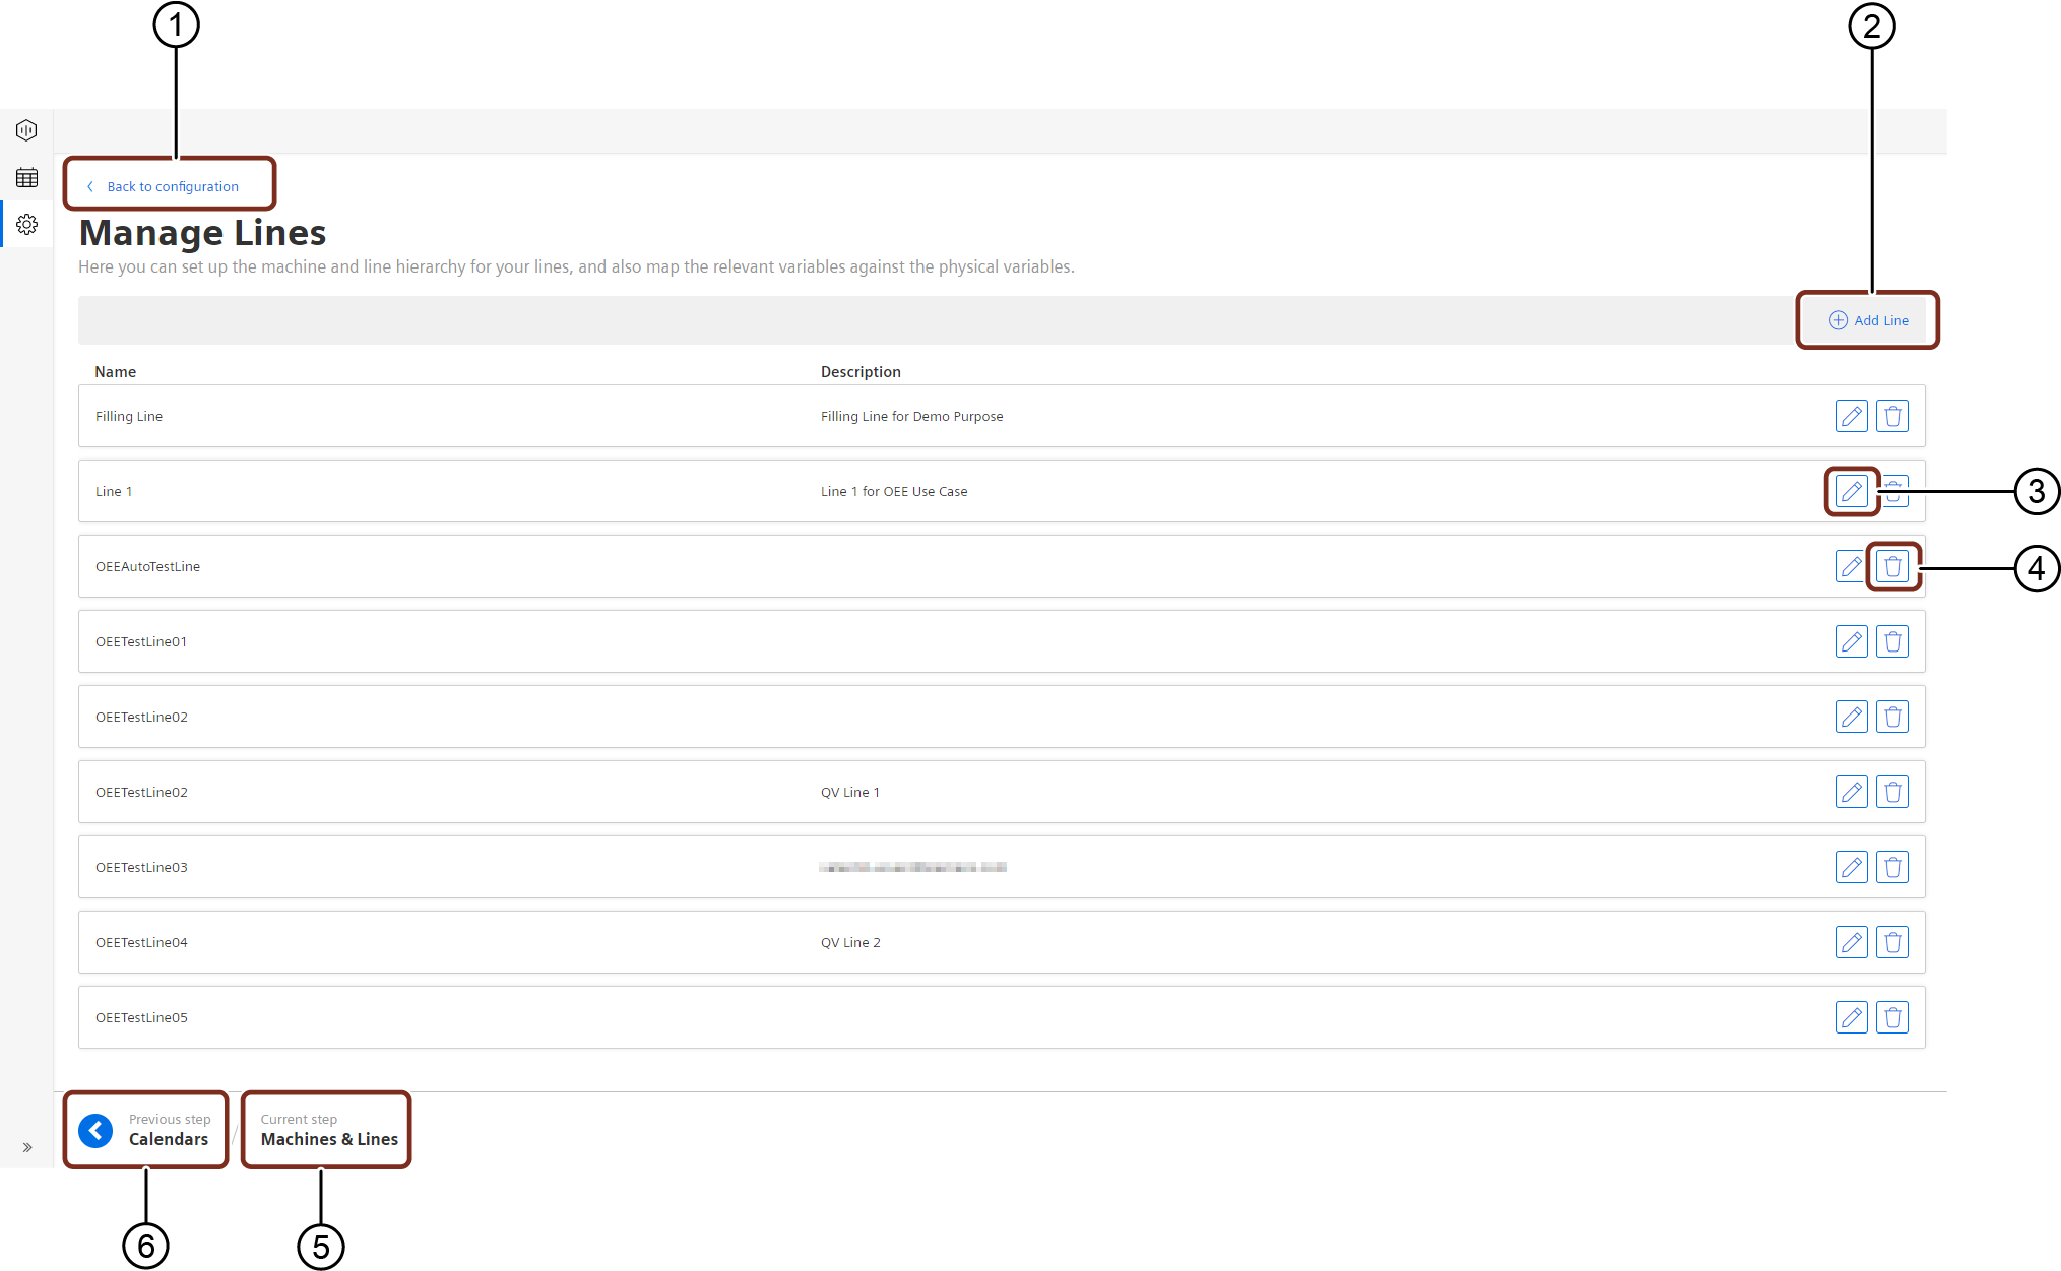
① Navigates to the “Configuration” tab
② Adds a new “Line”
③ Edits the existing “Line”
④ Deletes the existing “Line”
⑤ Displays the current step
⑥ Navigates to the previous step
Procedure
To add a new line and the corresponding machines, proceed as follows:
- From the navigation tab, click “Configuration” and select “Machines & Lines”.
- In “Manage Lines”, click “Add Line”.
The following window appears: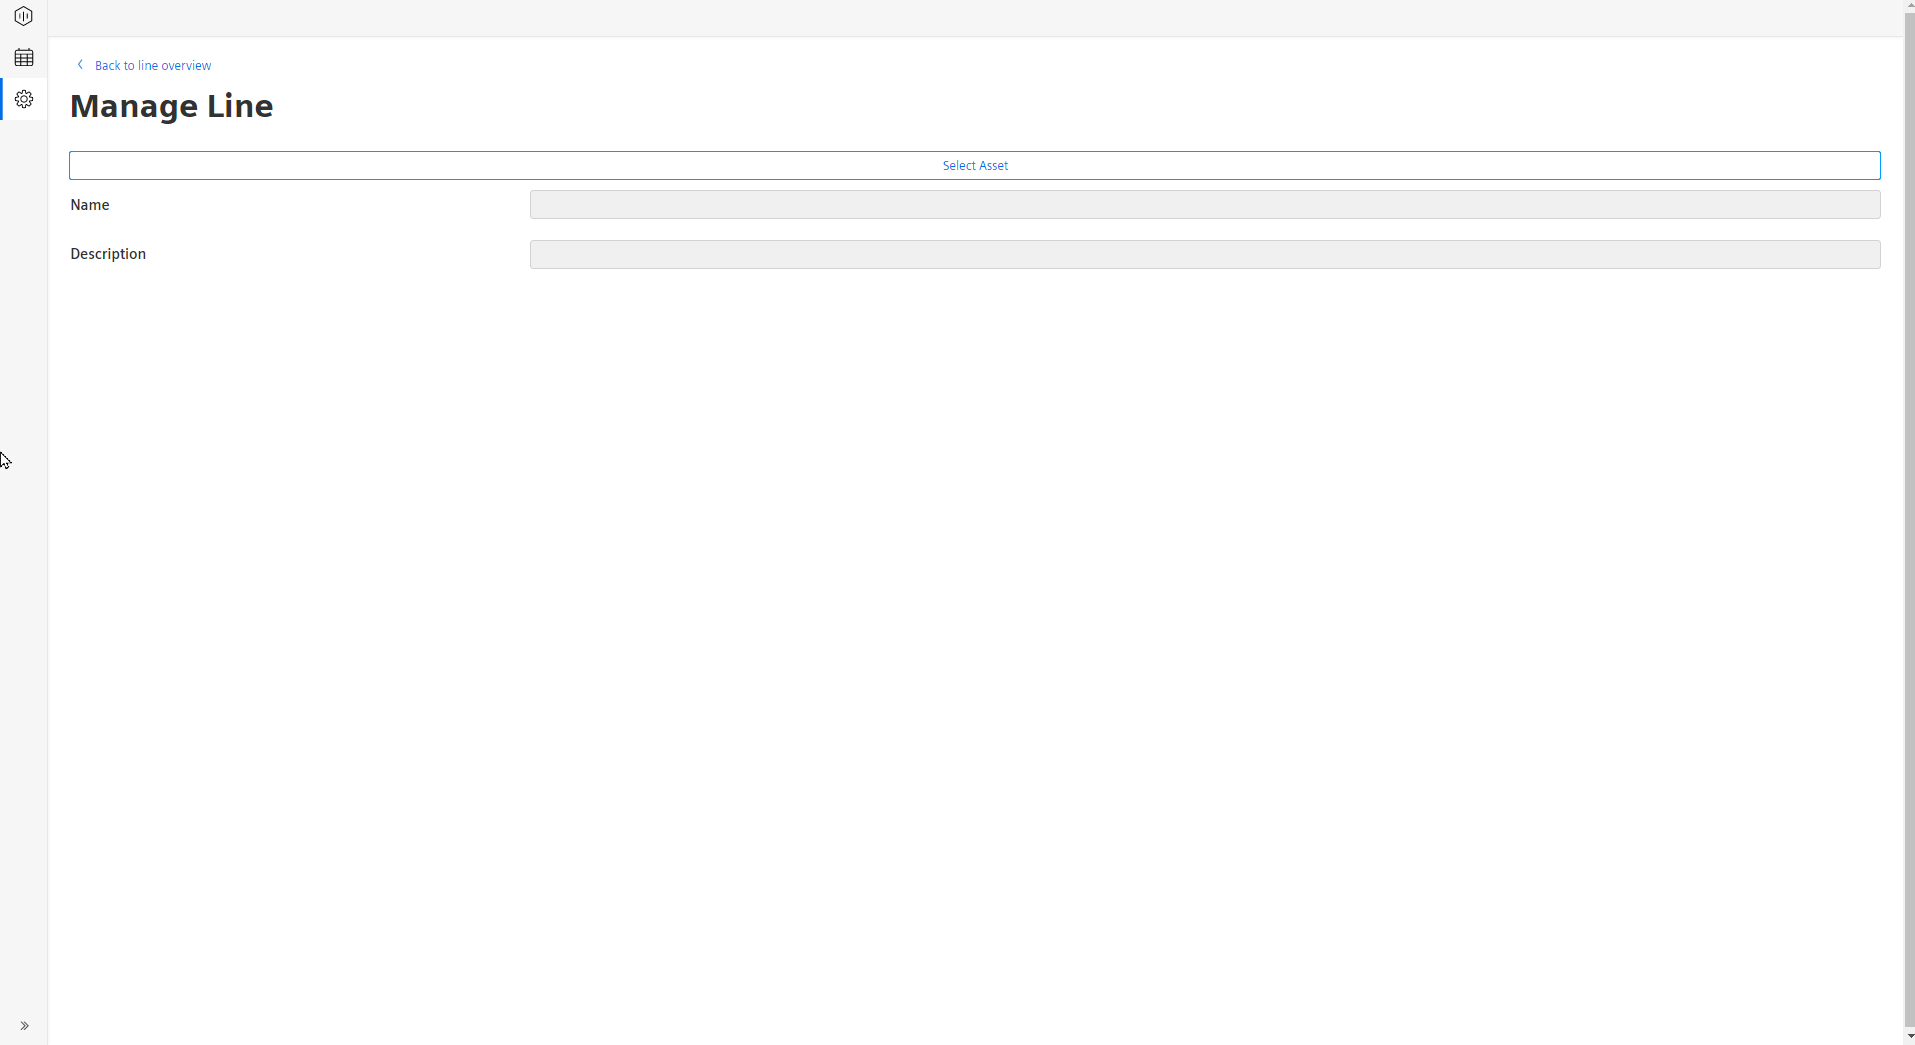
- Click “Select Asset”.
The following window appears: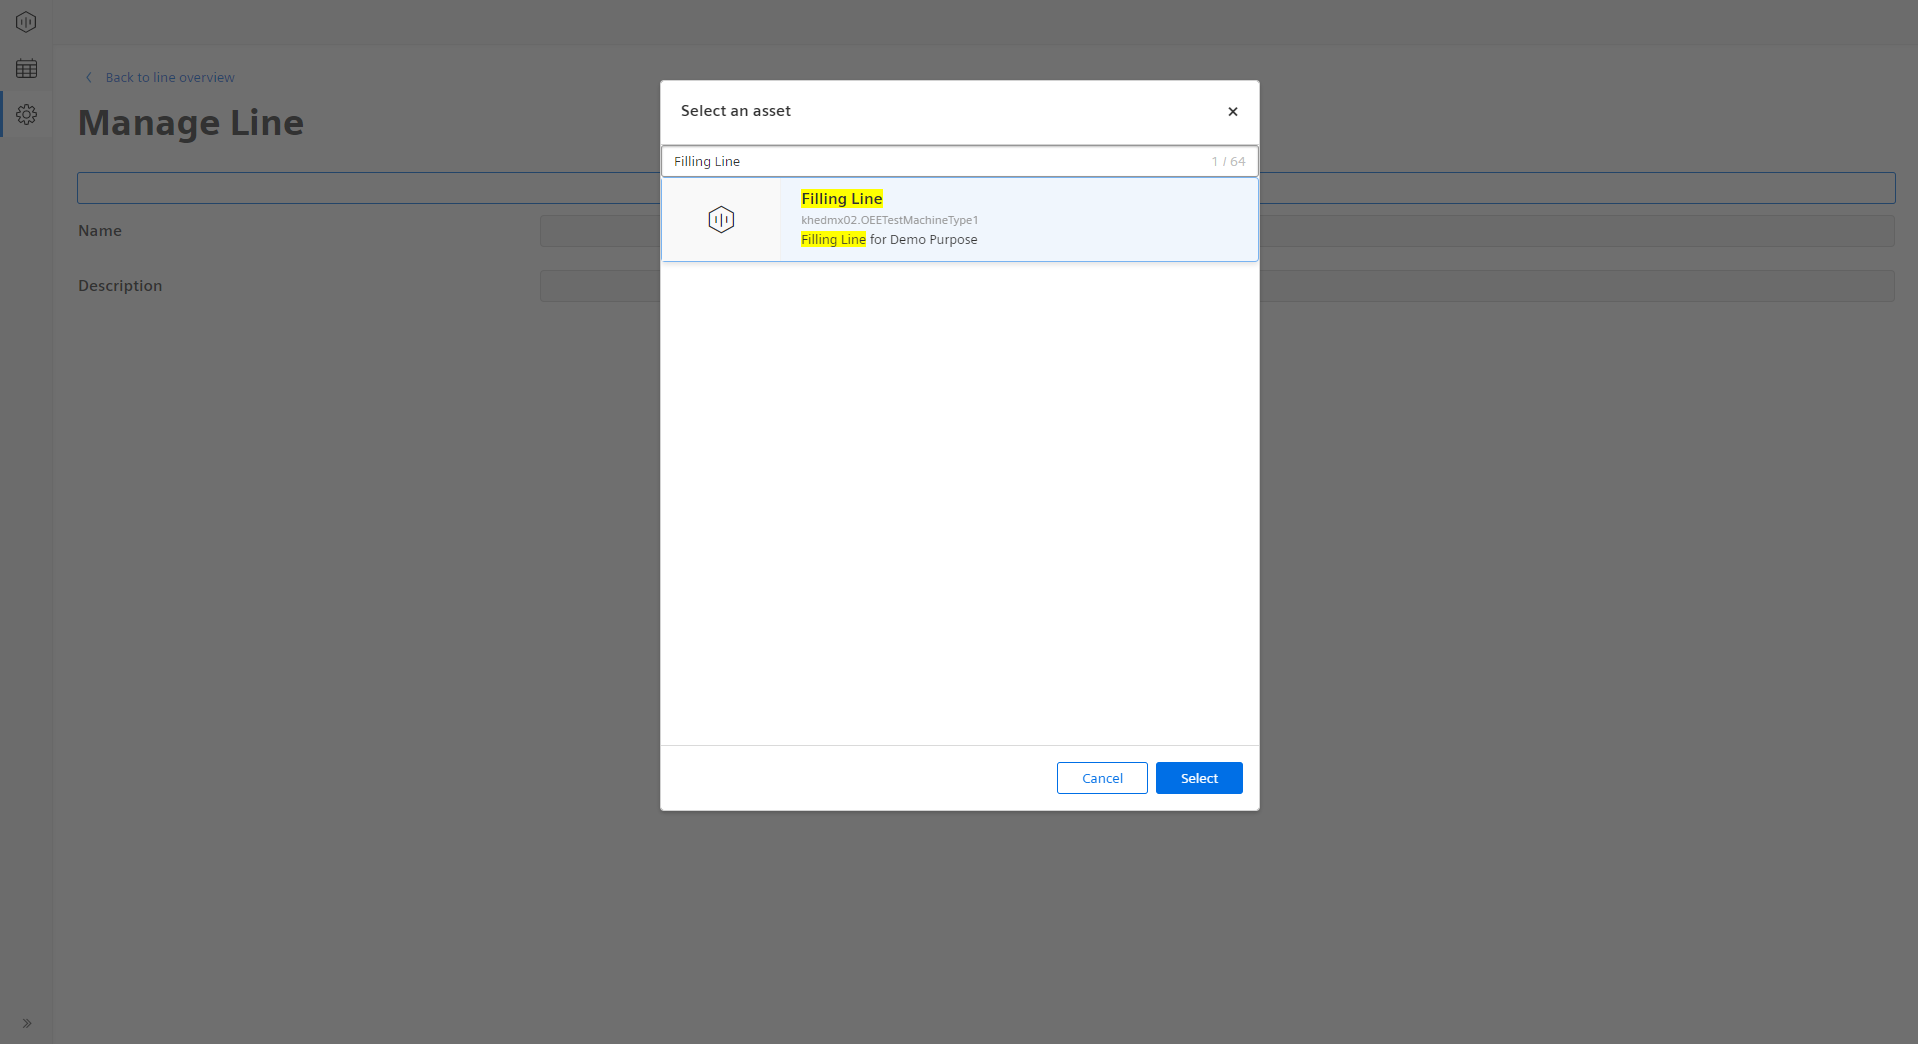
- Select the desired “Asset” from the list and click “Select” to auto-fill the asset parameters.
The following window appears: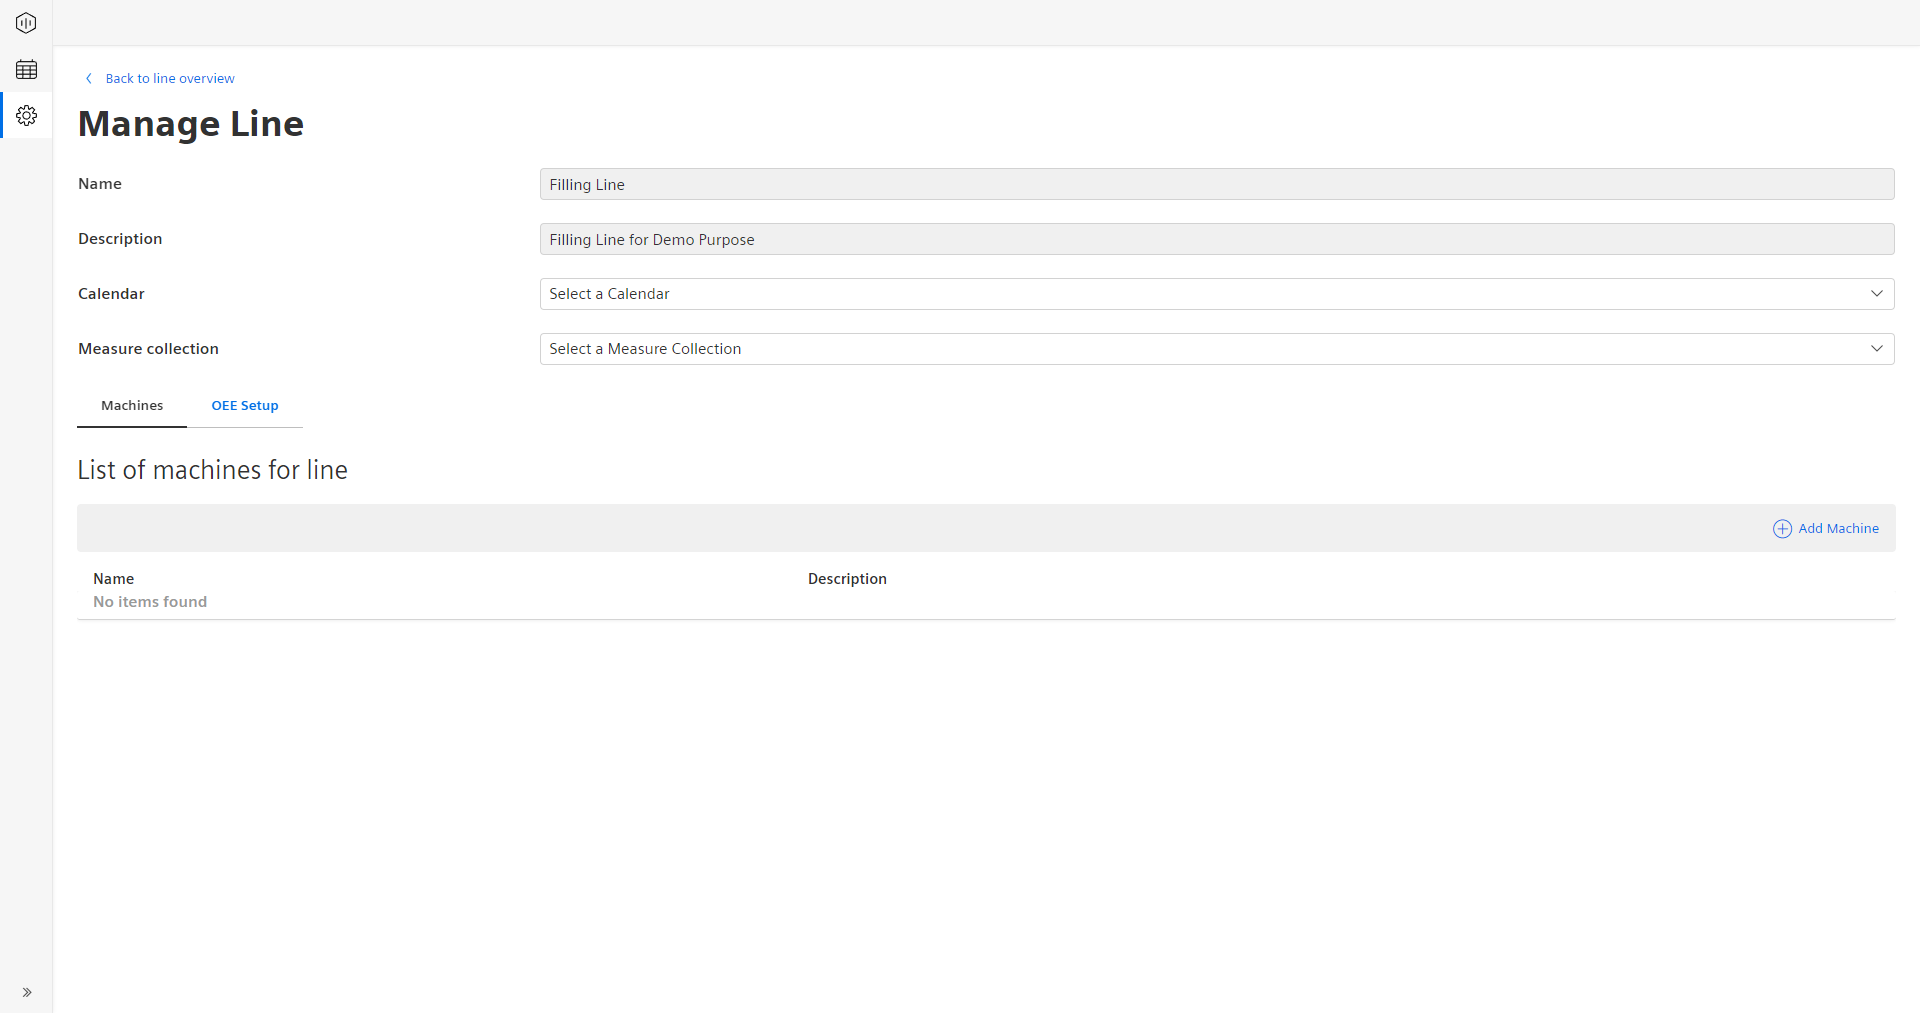
- Using the “Calendar” dropdown option, select the calendar that you have instantiated earlier. Every created calendar will appear here. If the dropdown list is empty, create a calendar before it can be assigned to the line.
- Using the "Measure collection" dropdown option, select the measure collection that you have instantiated earlier. Every measure collection will appear hear. If the dropdown list is empty, create a measure collection before it can be assigned to the line.
- Using the "Reject reasons collection" dropdown option, select the appropriate reject reason collection that you have created previously. Every reject reason collection will appear here. If the dropdown list is empty, please create a reject reason collection before it can be assigned to the line.
- Click the “OEE Setup” tab to configure and enable the OEE calculation for the line.
The following window appears: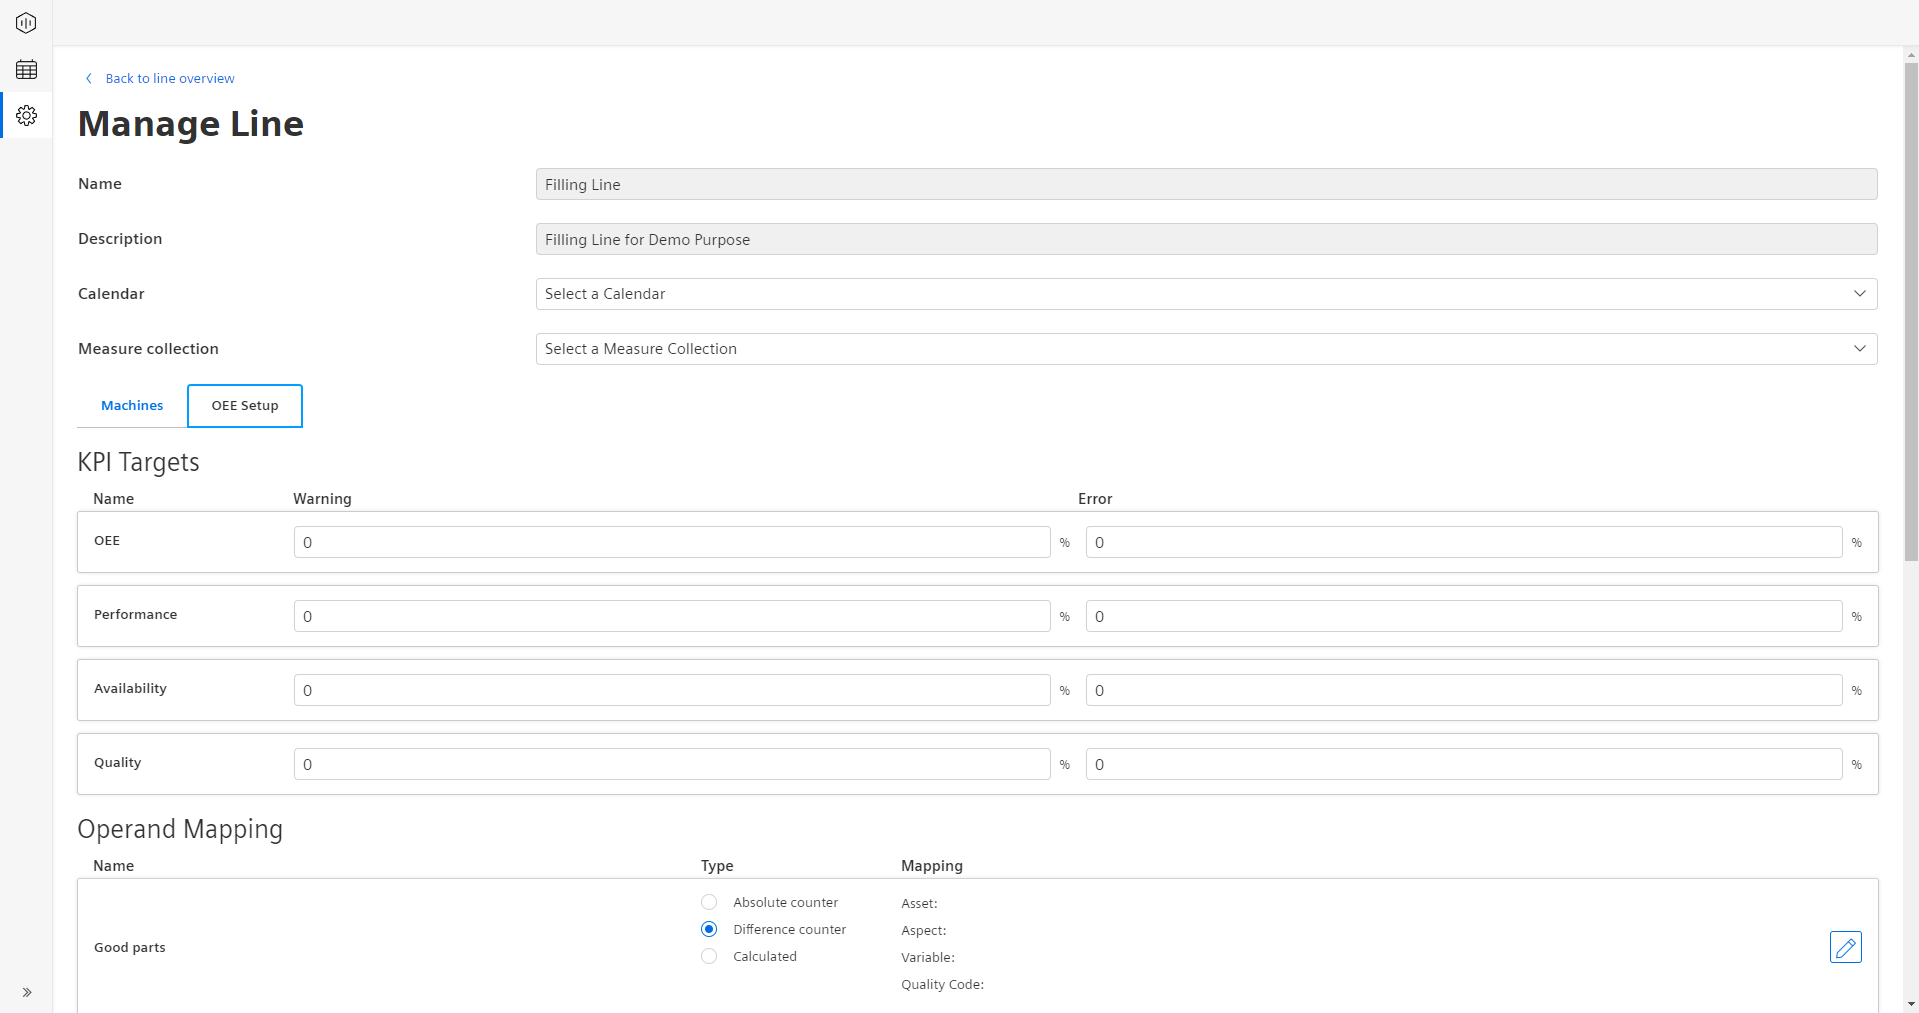
- In the “KPI Targets” area, you can modify the bandwidth for Error, Warning and Success displayed through the colors Red, Yellow, and Green in the gauges. It helps you to identify if you are currently reaching your targets or not. For this, fill in the table in the following way:
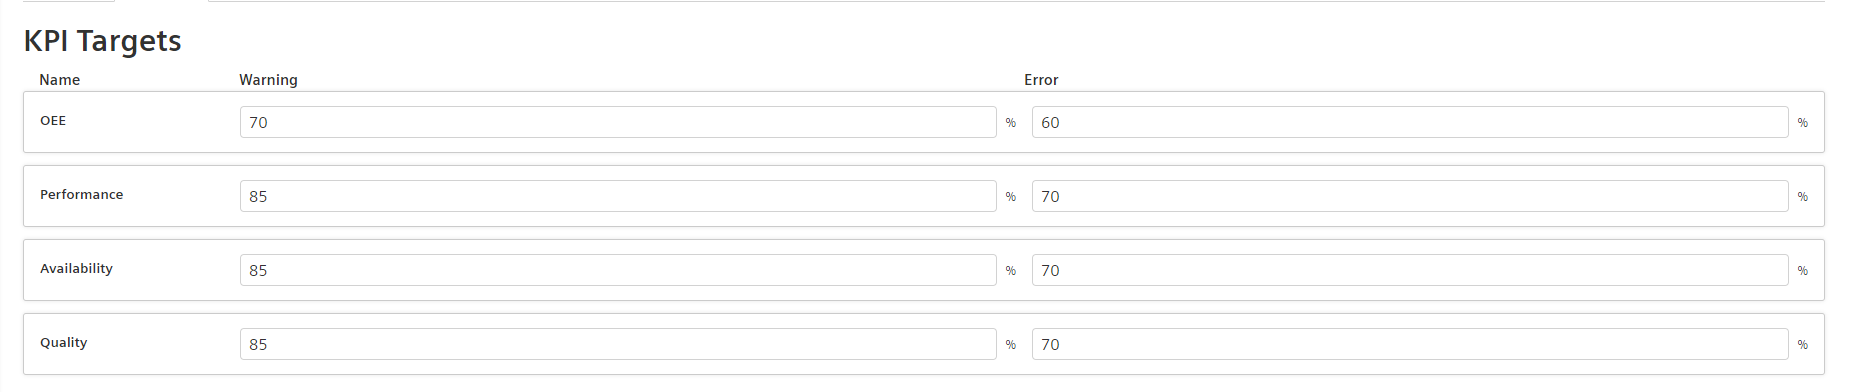
In the example above, two limits for Warning and Error are defined. The bandwidth for Success follows accordingly. In this example it works following in the following way:- OEE Warning: 70%
- OEE Error: 60%
The two values given in the configuration always describe the upper levels. Therefore, in the OEE gauge it will display the following colors for the following bandwidths: - Red: 0 - 60
- Yellow: 61 - 70
- Green: 71-100
The gauges for Availability, Performance, and Quality follow the same approach.
- OEE Warning: 70%
- Perform variable mapping. It has two steps, Operand Mapping and Source Mapping. Each step is described in detail later in this chapter.
If OEE needs to be calculated on a line level, five out of the following six variables must be specified for the line. The information can either be collected manually by the operator or fed into the system via IoT data. Nevertheless, the following table shows which variables are needed to calculate OEE.
| Variable | Mandatory |
|---|---|
| Status | Mandatory |
| Order | Optional |
| Product | Mandatory |
| Good Parts | Mandatory or auxiliary expression |
| Rejected Parts | Mandatory or auxiliary expression |
| Total Parts | Mandatory or auxiliary expression |
The following logic applies to the three Quality KPI relevant variables - good parts, rejected parts, and total parts. You need to map two out of three variables, two data points from the asset model and the third one can be calculated through the auxiliary expression which you need to select in that step.
Refer to Section Configuring KPIs to learn about the auxiliary expressions for the Good Parts, Rejected Parts, and Total Parts.
For all variables, that you can connect automatically, OEE also offers a manual option to feed in the data. Based on your configuration, you will be able to add certain data-points in the manual inputs page.
All variables now have a mode (manual or connected in the most cases) and a mapping option available. For operands, you can also determine different types depending on the configuration.
Operand Mapping
In the Operand Mapping, you map the counter variables for the quality KPI calculation - Good Parts, Rejected Parts, and Total Parts.
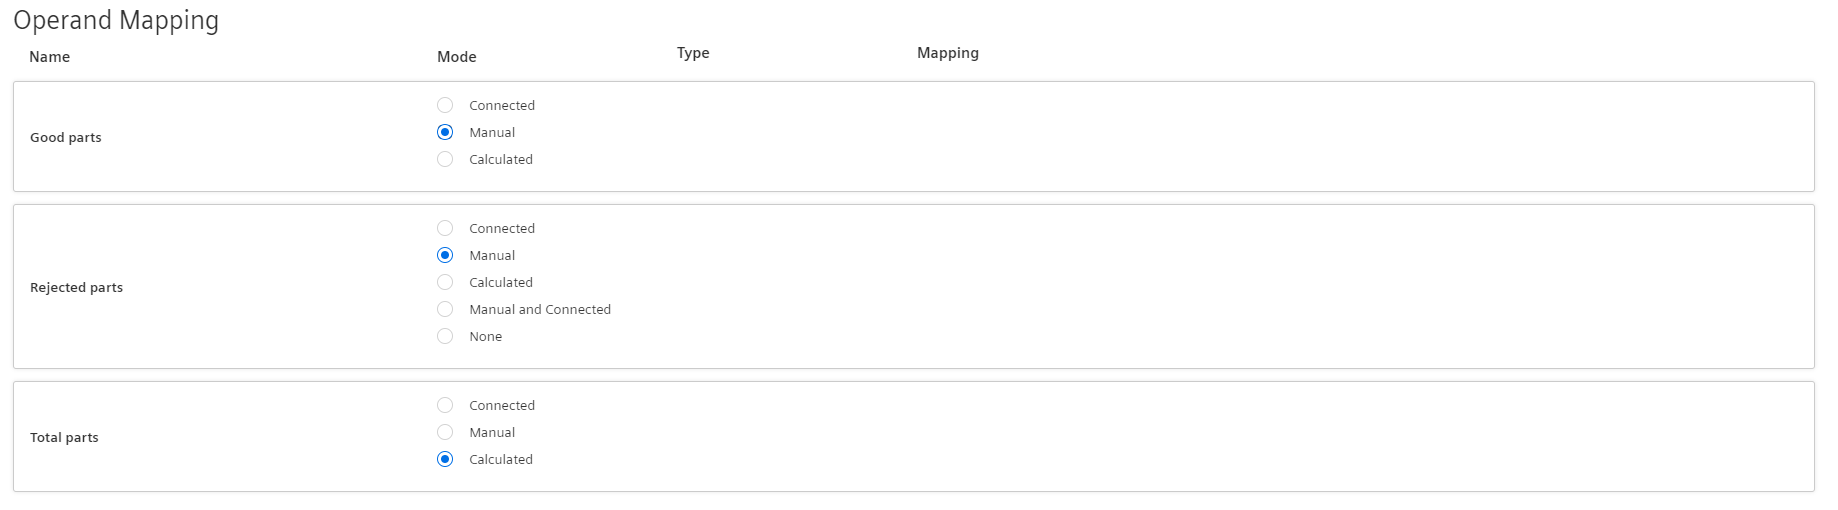
For each of them, you need to select a mode first. The following options are available for the different counters:
- Good Parts:
- Connected: A variable is available and can be mapped for the Good Parts counter
- Manual: The Good Parts will be provided manually via the manual inputs
- Calculated: The Good Parts are calculated based on the Total and Rejected Parts
- Rejected Parts:
- Connected: A variable is available and can be mapped for the Rejected Parts counter
- Manual: The Rejected Parts will be provided manually via the manual inputs
- Calculated: The Rejected Parts are calculated based on the Good and Total Parts
- Manual and Connected: In this mode, you connect a variable for the rejected parts but they can be increased afterwards again in case you need to adjust. For instance, your machine counter provides that you produced 480 rejected parts for a given time-frame, but number should be increased to 500 due to additional quality control afterwards, then you can do this change in the manual inputs section. Nevertheless, you need to be aware that the 20 additional rejected parts are subtracted from the good parts, if they are in the connected mode. A reduction of rejected parts is not supported, e.g. from 480 rejected parts to 460.
- None: Helps you to simply set the quality to 100%
- Total Parts:
- Connected: A variable is available and can be mapped for the Total Parts counter
- Manual: The Total Parts will be provided manually via the manual inputs
- Calculated: The Total Parts are calculated based on the Good and Rejected Parts
If you select either the "Connected" or "Manual and Connected" mode, you also need to select a type. Following two different types for the connected variables are available:
-
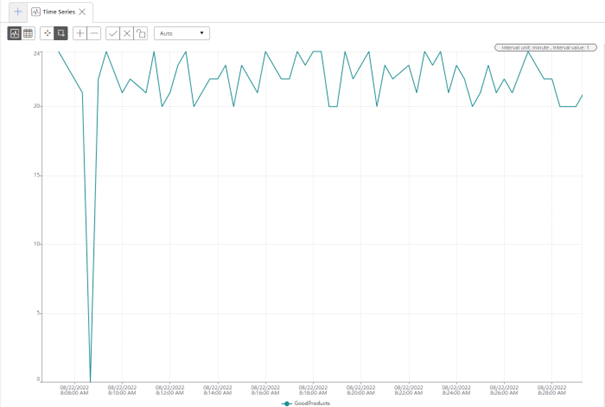
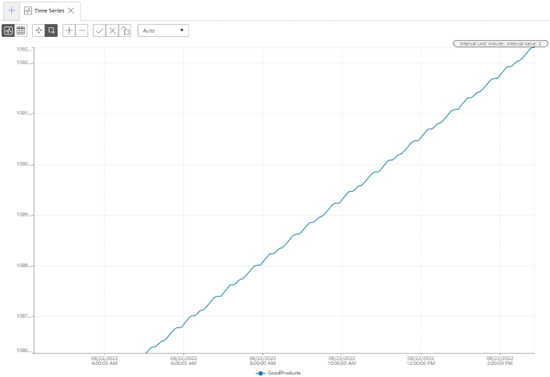
Difference Counter: The machine sends a counter value of the pieces, that were produced since the last time a counter value was sent to. In the picture below you can see that the value for the counter ranges between 20 and 24, this means that each time a counter value was sent to, 20 to 24 pieces were produced".
-
Absolute Counter: An absolute counter continuously counts up and is reset to 0 from time to time, for example, after a shift. In the picture below, you can see a typical absolute counter.
 Insights Hub OEE also automatically detects counter resets coming from the machine. Once the following value is 60% smaller than the previous value, then OEE will interpret this as a counter reset.
| Timestamp | Absolute counter value | Delta value |
|---|---|---|
| 12:00 | 1000 | - |
| 12:01 | 12 | 12 |
| 12:02 | 14 | 2 |
This behavior described in the table above would be interpreted as a counter reset by OEE, as you can also see in the delta values.
| Timestamp | Absolute counter value | Delta value |
|---|---|---|
| 12:00 | 1000 | - |
| 12:01 | 997 | 0 |
| 12:02 | 1001 | 1 |
This behavior described in the table above would not be interpreted as a counter reset by OEE. Here, the second value would be ignored by OEE.
First, there will be a connected parts counter scenario described.
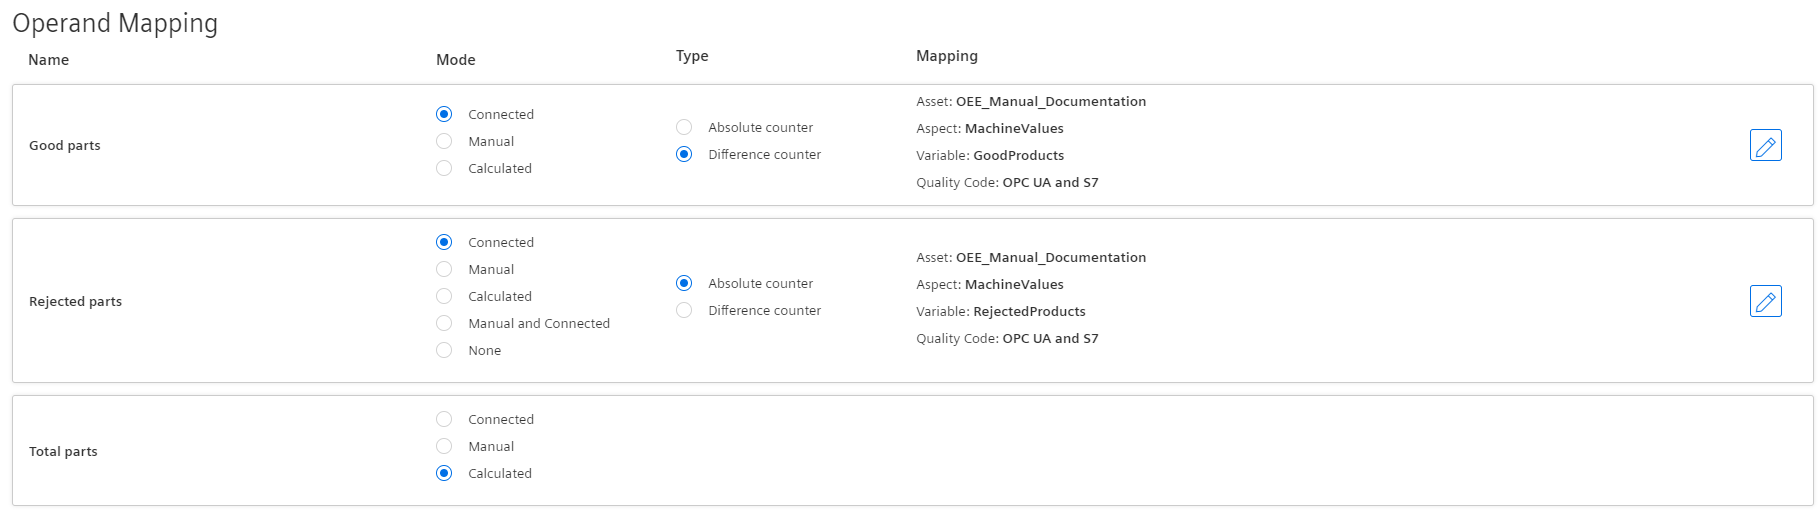
In the following scenario, good parts and rejected parts are measured through variables as difference counters, while the total parts are calculated through the auxiliary expression. To map these variables, proceed as follows:
- Select the Mode "Connected" and Type “Difference counter” using the radio button for the Good Parts.
- Click the Pen icon
 on the right side to open the Asset / Aspect selector.
The following window appears: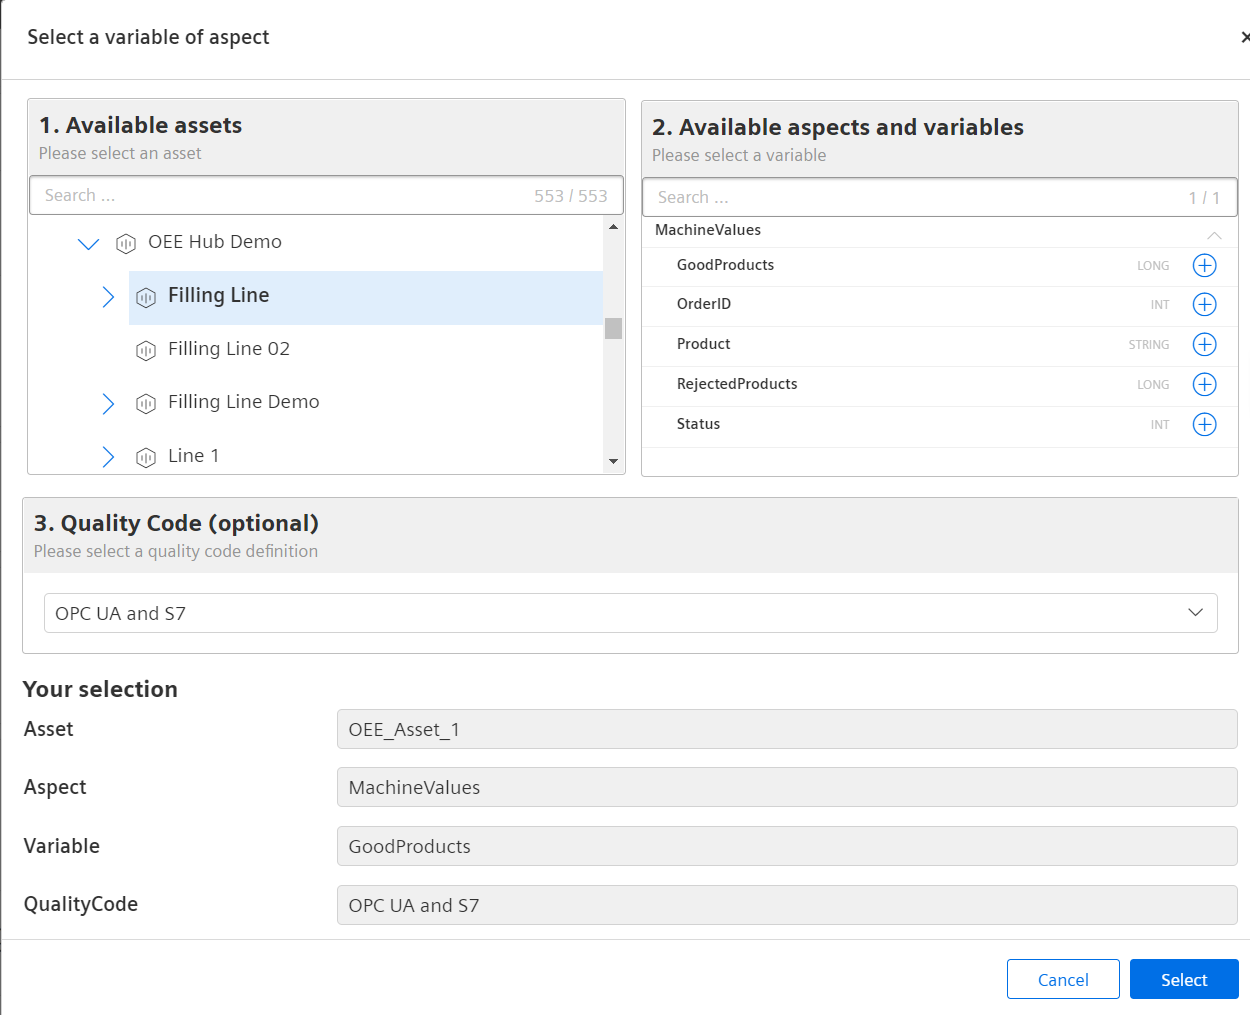
By default, “Filling Line” asset is selected as shown in the above image and the selection is also highlighted. The selected assets affects the variables and aspects listed under "Available aspects and variables". - Click the
 icon next to the variable of your choice.
"Your selection" section displays the selected asset, aspect, and variable.
In this example, the selected asset is “Filling Line”, the aspect is “Machine Values” and the selected variable is “GoodProducts”. Additionally, you can also select a default quality code definition or a custom quality code definition, which was created before. By default, the “OPC UA and S7” option will be selected. If the data-point has no quality code attached, this selection does not have an influence on the data-point collection. Only if the selected variable also uses quality codes, these will be evaluated by Insights Hub OEE. To learn more about quality codes, for more information, refer to Configuring Quality Codes. - Once the selection is done, click “Select”.
- For Rejected Parts, follow steps 1 to 4 again.
- For measuring the "Total Parts", proceed as follows. Select the Mode “Calculated” using the radio button. The following screen shows the completed Operand Mapping for a connected asset:
Note
Two other scenarios are also possible here:
Scenario 1: Rejected Parts and Total Parts measured through variables, therefore the type for Good Parts has to be “Calculated” and the dropdown selection has to be “Good Parts”.
Scenario 2: Good Parts and Total Parts are measured through variables, therefore the type for Rejected Parts has to be “Calculated” and the dropdown selection has to be “Rejected Parts”.
In the following section also a complete manual example will be provided.
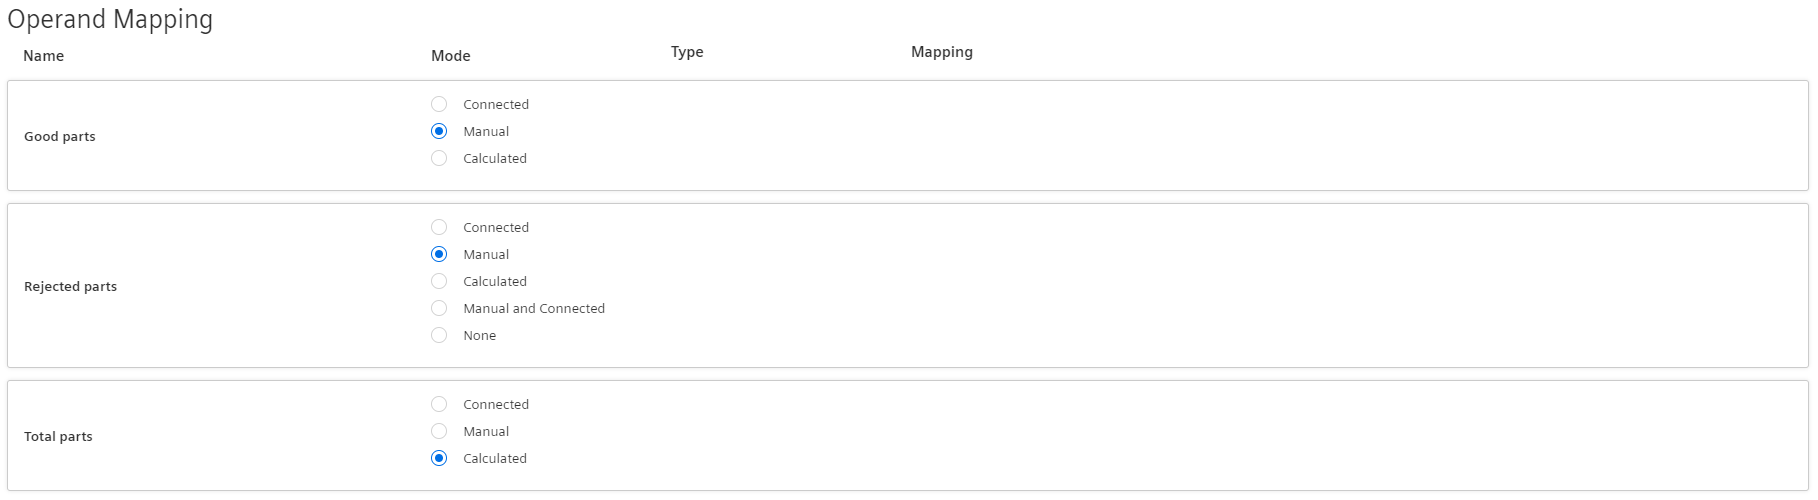
- Select the Mode "Manual" using the radio button for the Good Parts.
- Select the Mode "Manual" using the radio button for the Rejected Parts
- Select the Mode "Calculated" using the radio button for the Total Parts.
Here, you do not have to select a type, since in manual mode all counters are treated as difference counters. In the manual input section, you always put in the numbers for the given time-frame.
The following screen shows the completed Operand Mapping for a manual asset:
Of course, multiple combinations of the different modes and types can exist, which unfortunately, can't all be documented in here.
Next step in the configuration is Source Mapping. Of course, Insights Hub OEE also provides both connected and manual options.
Source Mapping
The Source Mapping follows a similar approach compared to Operand Mapping. In this section, also two examples, one manual and one connected will be provided.
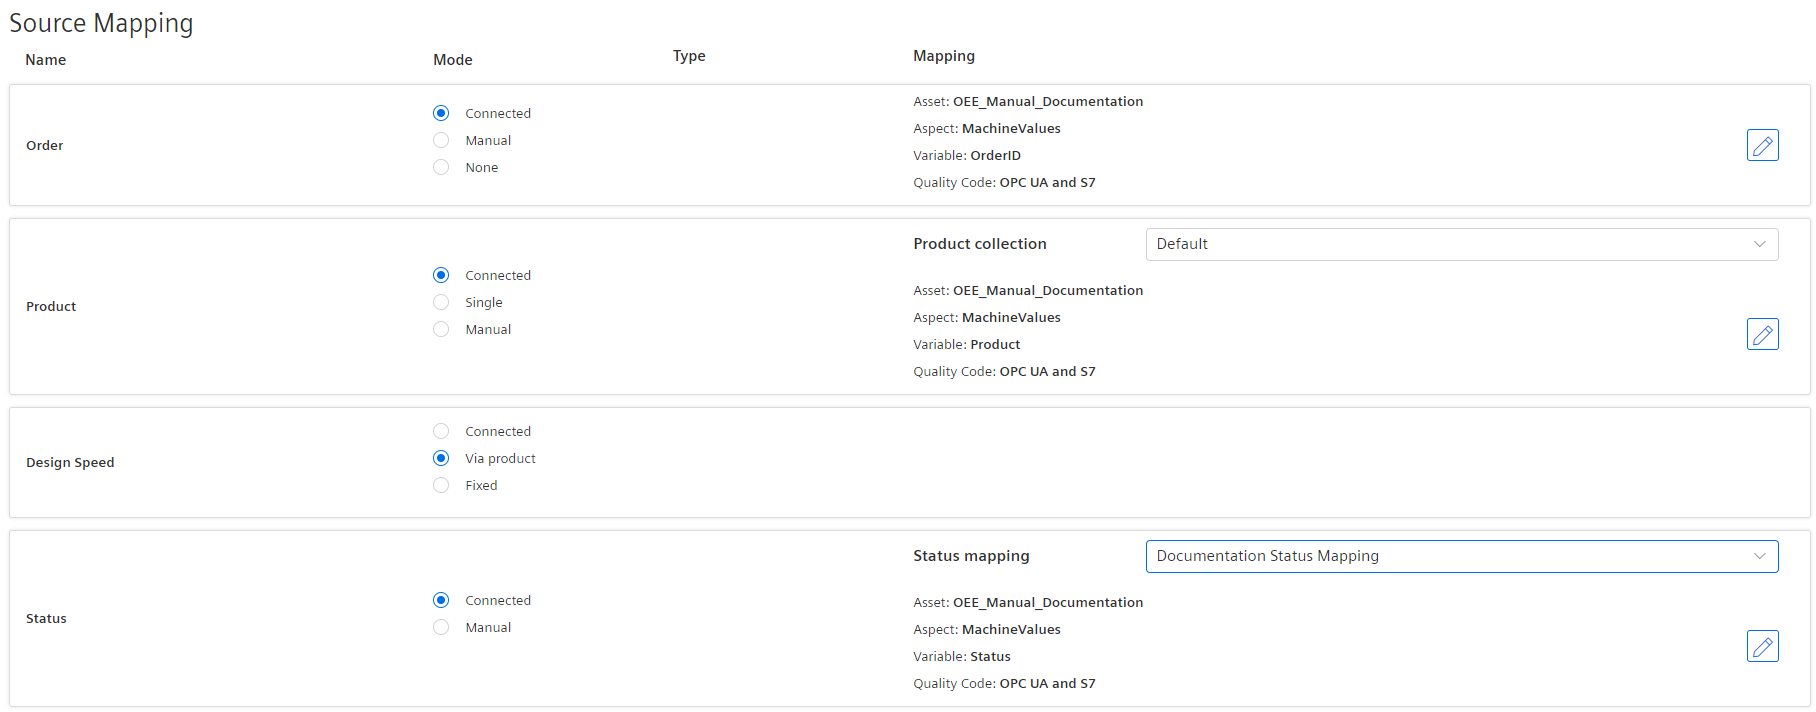
In the Source Mapping, for order, product and status multiple modes exist again:
- Order:
- Connected: A variable is available and can be mapped for the order information
- Manual: The order information will be provided manually in the manual inputs section
- None: No order is needed and there this filter option is disabled
- Product:
- Connected: A variable is available and can be mapped for the product information. The system will read the product code from the variable.
- Single: A single product from a product collection is chosen by the user, no further specification of a variable is required.
- Manual: A product collection needs to be selected by the user and the product itself is then selected from the collection in the manual input section.
- Status:
- Connected: A variable is available and can be mapped for the status information. The user also needs to specify a status mapping
- Manual: The status is provided manually via the manual inputs. The user also needs to specify a reason tree.
Let's first look in to the connected example.
- Click the Pen icon on the right side to map the Order information.
The following Asset / Aspect selector window appears: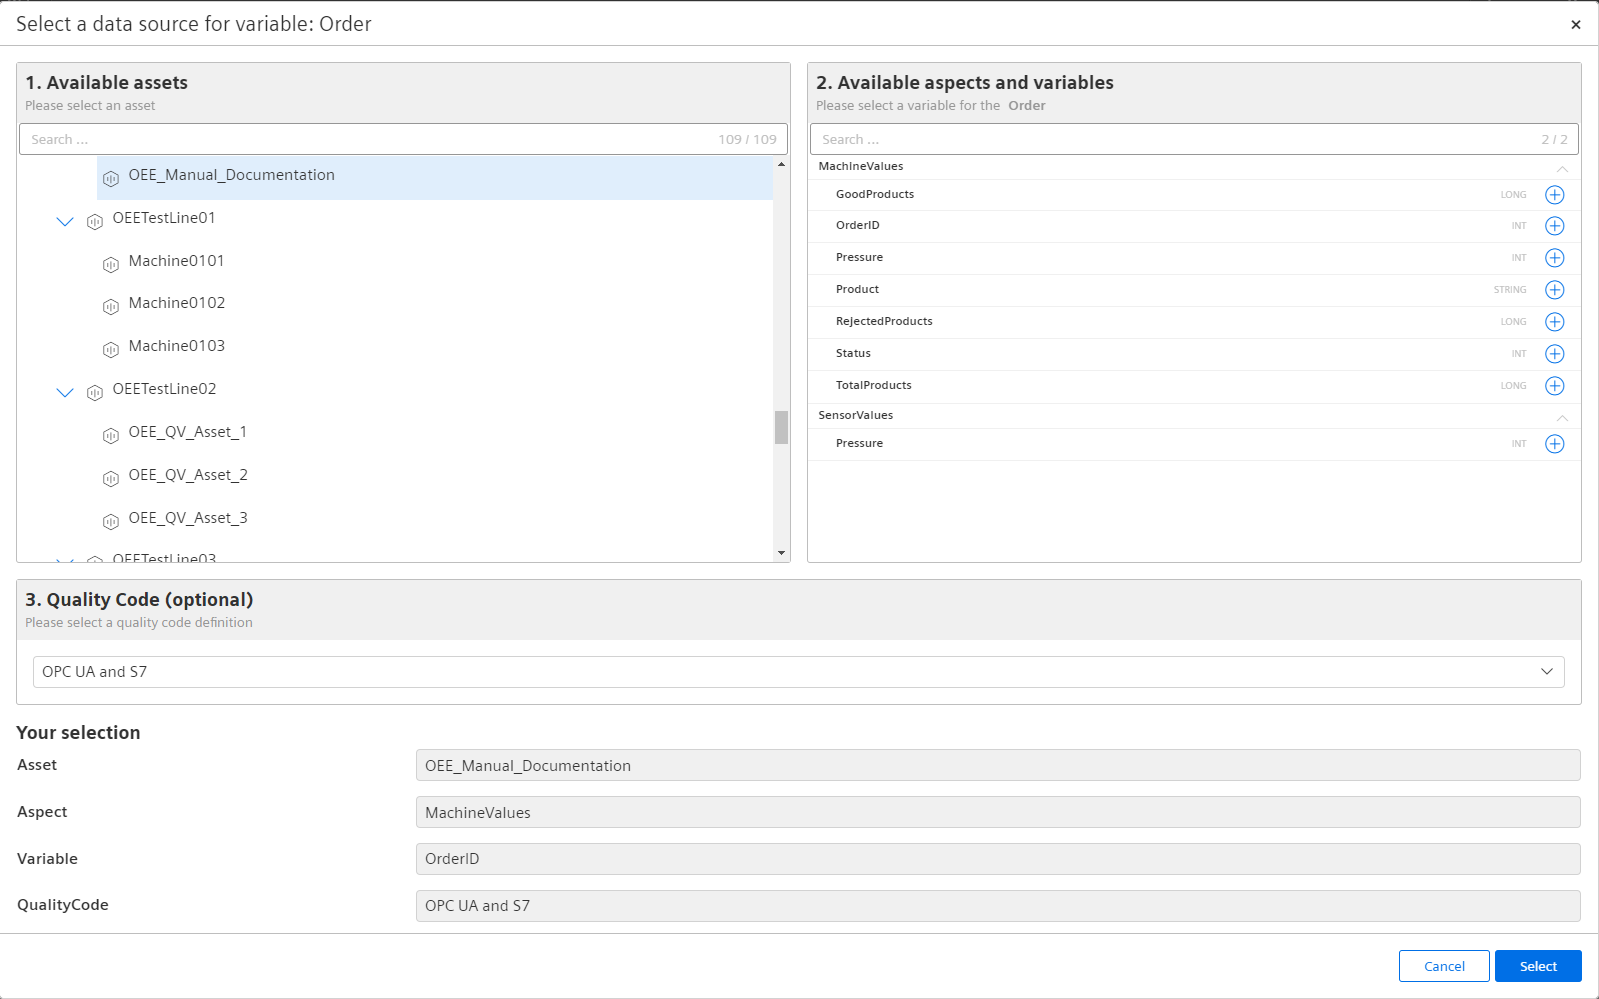
The image shows the selected asset, which is also highlighted. The selected assets affects the variables and aspects listed under "Available aspects and variables". - Click the icon next to the variable of your choice.
"Your selection" section displays the selected asset , aspect, and variable.
In this example, the selected asset is “OEE_Manual_Documentation", the aspect is “Machine Values” and the selected variable is "OrderID". Additionally, you can also select a default quality code definition or a custom qualtiy code definition, which was created before. By default, the “OPC UA and S7” option will be selected. If the data-point has no quality code attached, this selection does not have an influence on the datapoint collection. Only if the selected variable also uses quality codes, these will be evaluated by Insights Hub OEE. To learn more about quality codes, for more information, refer to Configuring Quality Codes. - Once the selection is done, click “Select” and the window will get closed.
- For Products, select the suitable Mode first. In this case "Connected" is selected. Then choose the product collection from the dropdown. Once the suitable product collection is selected, click on the pen icon to choose the proper variable like you did for the Order ID via the input screen. If you select the single product option, choose one product from the next dropdown, which means that the machine only produces one product all the time and therefore a variable mapping is not necessary anymore.
 If you choose the multiple products option, then you need to follow the steps again to select the proper variable after you click on the pen icon.
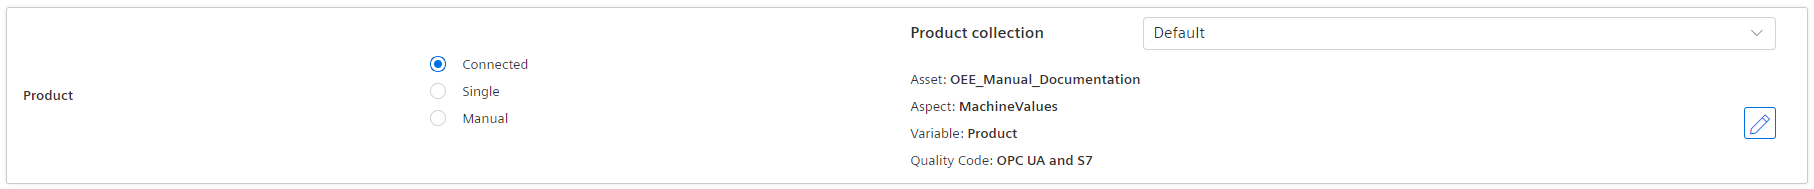
- For Status Mapping, select the applicable Status Mapping from the dropdown “Select Status Mapping”.
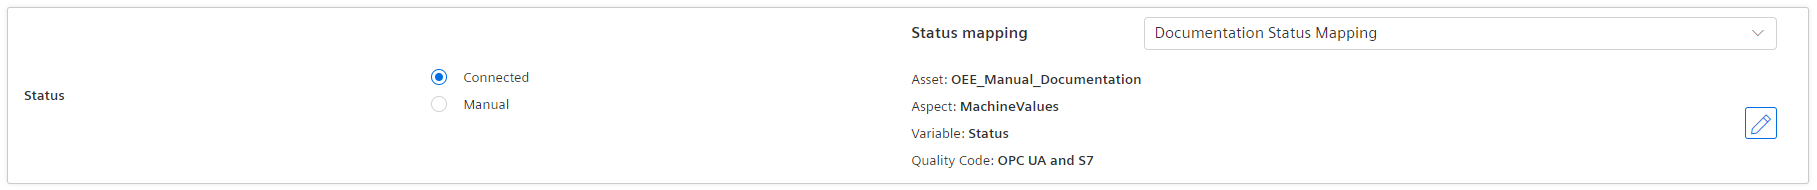
It is recommended to create a Status Mapping in advance. For more information on this topic, refer to Section Configuring Status Mapping. - Once the applicable status mapping selection for the line asset is done, select the variable where to find the status information. This follows the same process as the order and product information.
The following screen shows the completed Source Mapping in the "Connected" mode:
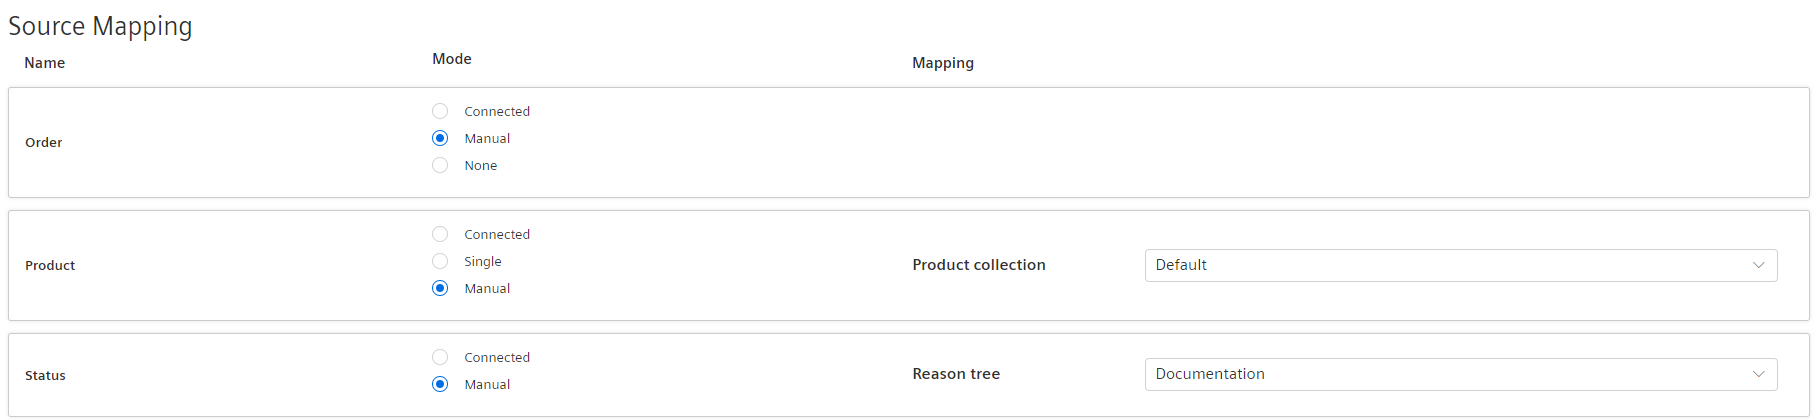
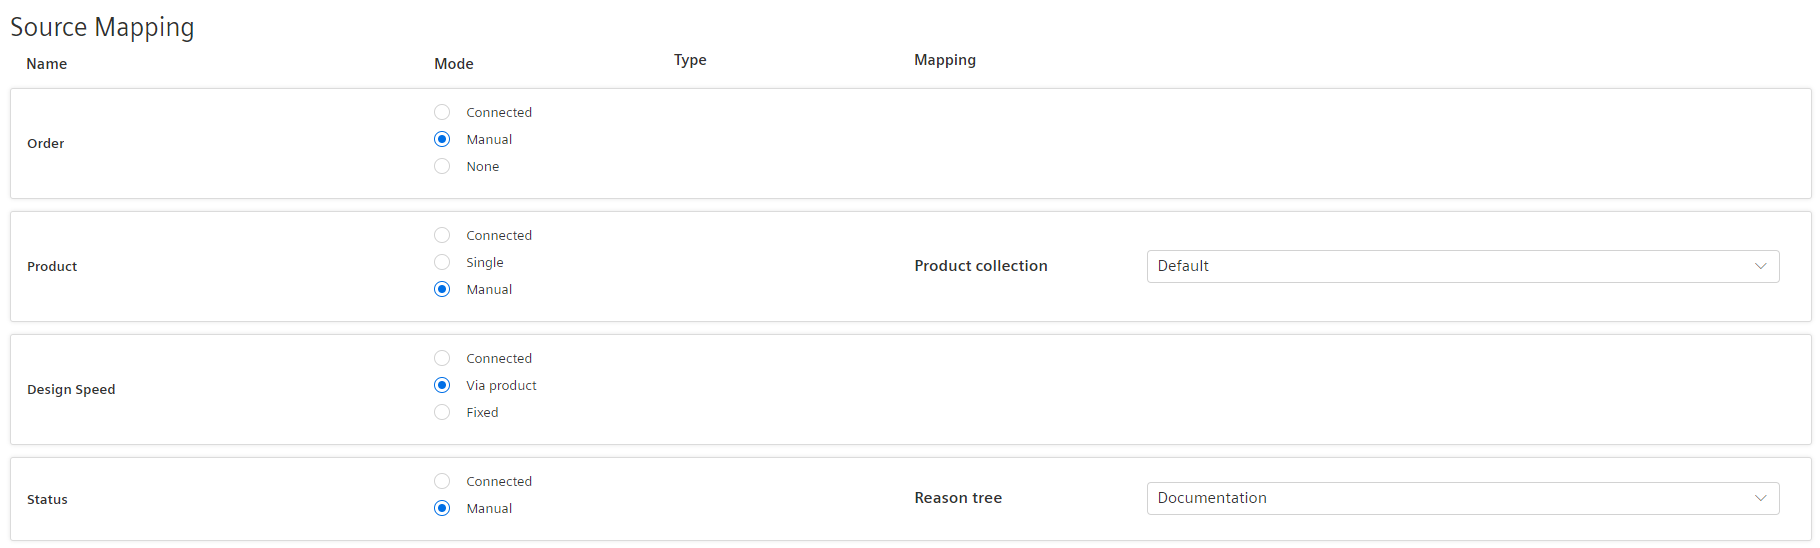
The second example shows a set-up for an all "Manual" Mode Source Mapping. The manual set-up is shorter, as it doesn't require data mappings.
- Select "Manual" as the mode for the Order. This will allow you to put in any kind of information in the Manual Inputs section for the order.
- Select "Manual" as the mode for the Product. As a second step you still need to select one product collection from the dropdown. Later, in the Manual Inputs section you will assign one of the products from the product collection for the different time-ranges.
- Select "Manual" as the mode for the Status. In addition, you also need to select a reason tree from the dropdown, because you will be able to define the different machine states in a distribution based on the reason tree.
A complete Manual Mode setup looks like the following.
Of course, as also described in the Operand Mapping, many different combinations of Manual and Connected Modes exist. The documentation doesn't cover all of them; the focus is more on how to set it up for the different variables and to describe the differences..
Info
When both Operand and Source mappings are finished, the line asset configuration can be deemed complete.