Variable action panel
Variable action panel displays all the variables and their metadata which were added to the visualization area. By using the toggle button, the variables can be displayed or hidden within the visualization area.
Variable action panel screen
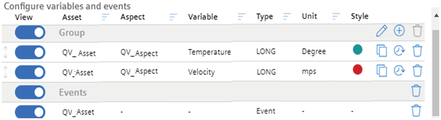
You can perform the following actions in variable action panel:
- View the currently selected variables from multiple assets.
- Sort the variables within the table by using drag and drop.
- Add individual axis for variables by adding multiple groups and adding multiple variables of different assets into the group. Variables can be added to a group through drag and drop.
- Display or hide variables within the visualization area. It can be done by the toggle button.
- Customize the colors, marks and ticks of the time series chart. It helps to differentiate among various variables in the time series chart. It can be done by clicking on the colored dot in style section.
- Duplicate variables by clicking duplicate icon or by adding variables from variable selection panel.
- Set time shift to the selected time range by creating an offset to a variable. Select a variable to set a time offset, click on offset icon to set a time range.
Last update: January 22, 2024