Timeseries
Introduction
The "Timeseries" extension provides the visualization of raw timeseries data. Visualization modes can be switched between raw, aggregates or an automatic mode for time-series visualization.
Up to 10 variables of an asset can be listed and added to a line chart.
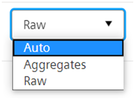
The user can select the data source for the line chart: Aggregates, Raw or Auto.
In Auto mode, the chart will automatically switch between Raw and Aggregates mode. If the selected time range is less than 2 minutes, data from IoT TimeSeries API is shown. Otherwise, the data from IoT Aggregates API is shown. The interval (for example, 2min, 1hour or 1day) is chosen depending on the time range automatically.
When using Aggregates the start, end, min, and max values are used in an aggregate interval to draw the line chart.
In Raw mode, the last 2000 values of the variables are shown.
If there is more data for this time range, a dotted line is shown to indicate that, after which the user can zoom into this range to detect more data.
Timeseries data types
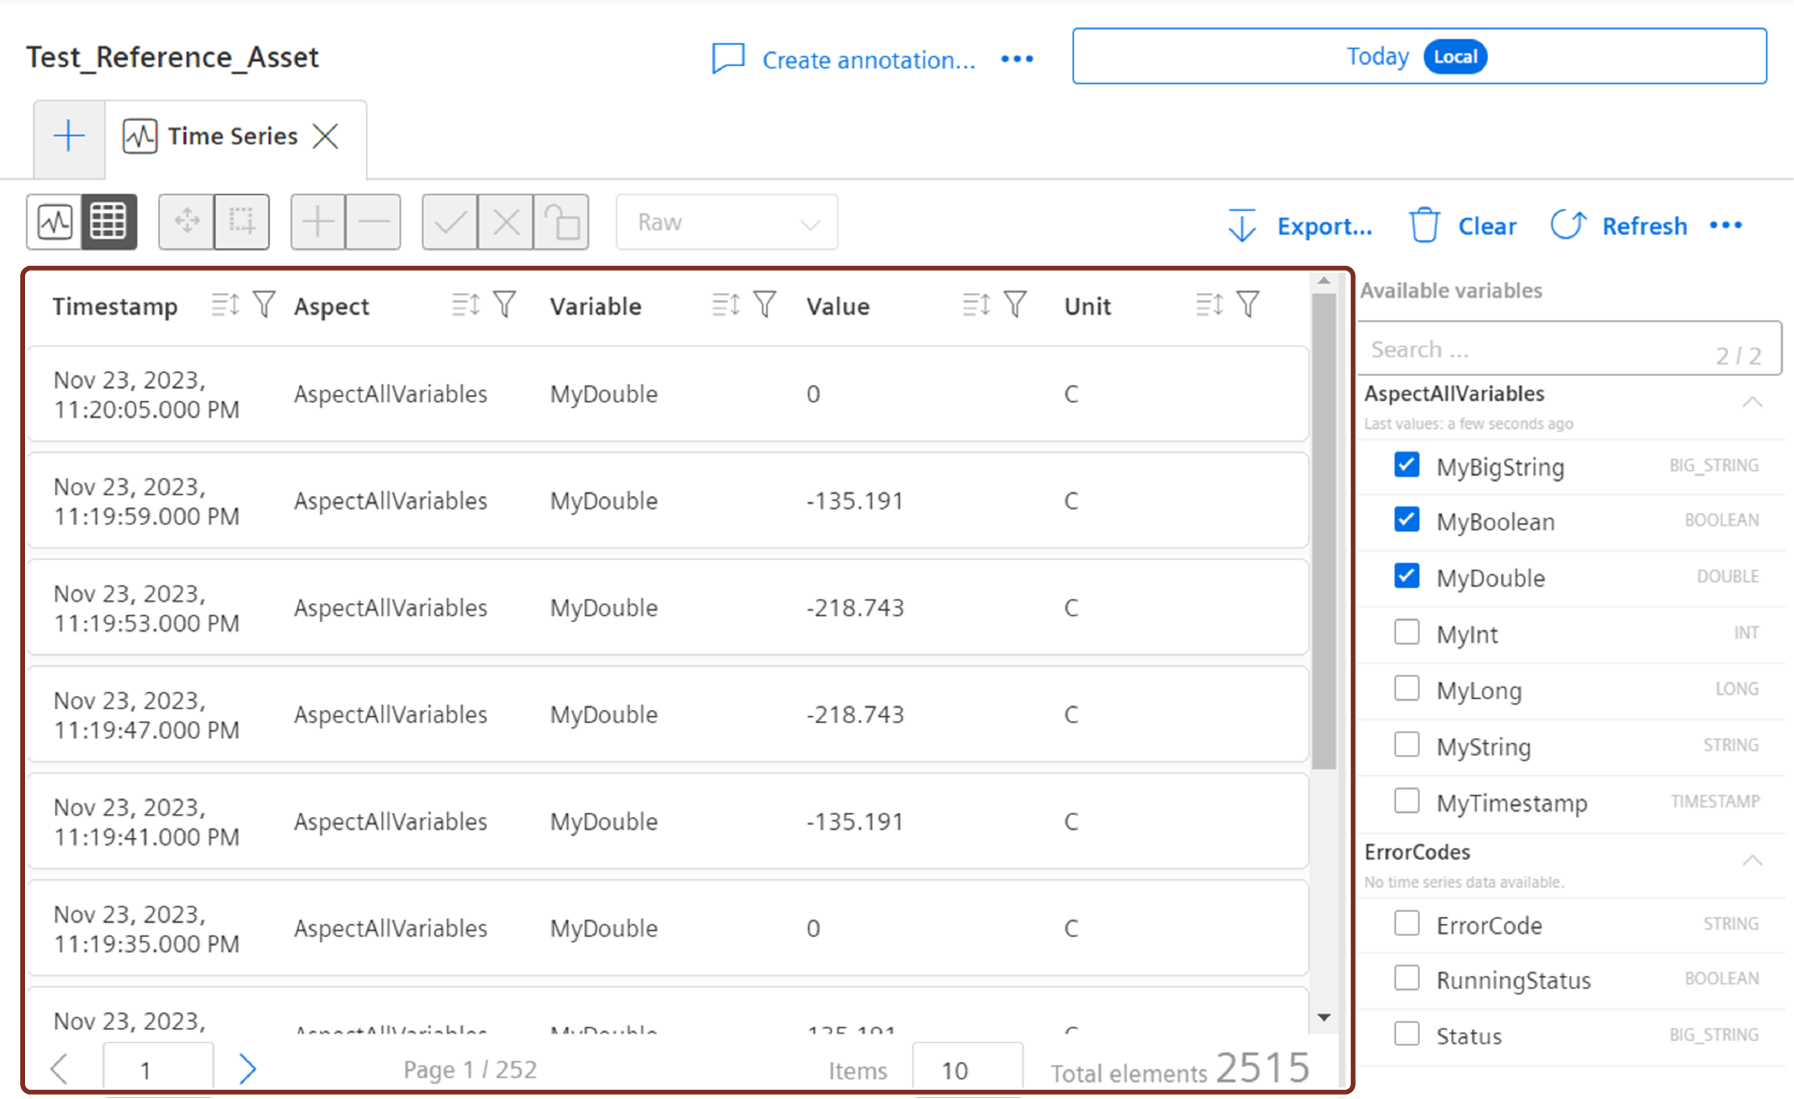
The "Timeseries" extension supports the dynamic datatypes which have been defined for this asset type for the visualization of the variables. Timeseries extension shows data in both table and chart mode for all supported datatypes. The timeseries data's variables are shown as line diagrams in the chart view and as a table with the quality code values in the table view.
The data variables can be selected from the select variables section and based on the variables selected, the data will be displayed.
The following list shows the supported data types:
- Integer: Data is displayed as a linear line chart
- Double: Data is displayed as a linear line chart
- Long: Data is displayed as a linear line chart
- Boolean: Data is displayed as a step line chart
- String: Data is displayed as icons
- Big String: Data is displayed as icons
- Timestamp: Data is displayed as icons
"Timeseries" extension user interface
The "Timeseries" extension graphically depicts timeseries data of your asset.
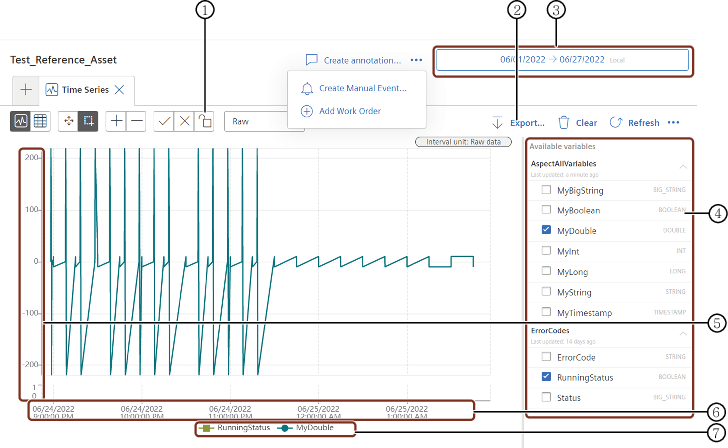
① Locks the Timeseries chart and no further requests submitted to Timeseries API
② Exports the Timeseries data
③ Timepicker: Selection and specification of the time zone and the time period of the visualization
④ Available variables: Selection of the various variables of the visualization
⑤ Y-axis
⑥ X-axis with the specification of time intervals
⑦ Selected variables
The table view of the "Timeseries" extension is as shown below:
Symbols
The following table shows the buttons of the "Timeseries" extension:
| Button | Description |
|---|---|
 | Graph view of the data |
 | Table view of the data |
 | Allows to move the Time range by drag |
 | Allows to select the Time range by drag |
 | Zoom in |
 | Zoom out |
| Apply the Time range selected by the zoom in or zoom out of the chart | |
 | Resets back the chart to the applied Time range after zoom in or zoom out of the chart |
 | Unlocked:Chart can be refreshed while zooming |
 | Locked: No requests to timeseries api are submitted |
| Allows to switch between the visualization modes | |
| Clear icon | |
 | Refreshes the chart |
 | Opens Timeseries section with the selected variables |
Visualization modes
Visualization modes allows you to switch between raw, aggregates or an automatic mode for timeseries visualization.
In Auto mode the chart will switch to timeseries data, if the selected time range is less than 2 minutes.
In Raw mode the last 2000 values of the variables are shown.
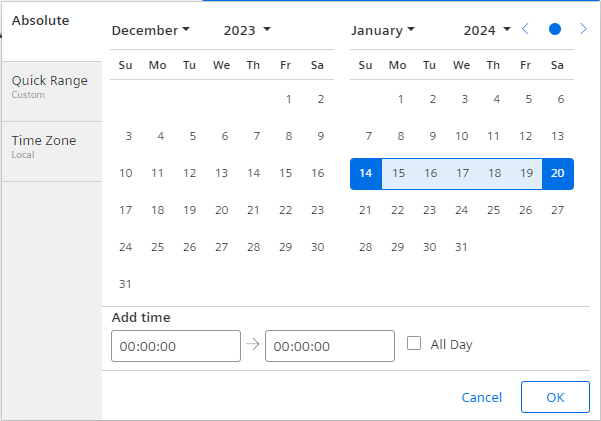
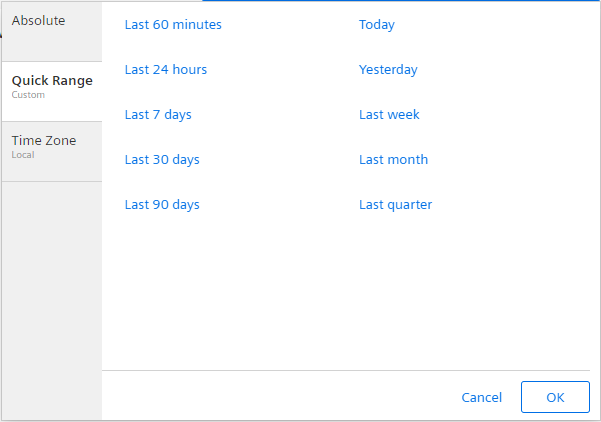
"Time selection panel" user interface
The graph shows the set time period in the Time selection panel.
Time selection panel offers you to select the required time range in the following ways:
-
Absolute: Allows you to select the time range between the "From" date to "To" date.
-
Quick Range: Allows you to select the predefined quick time range.
-
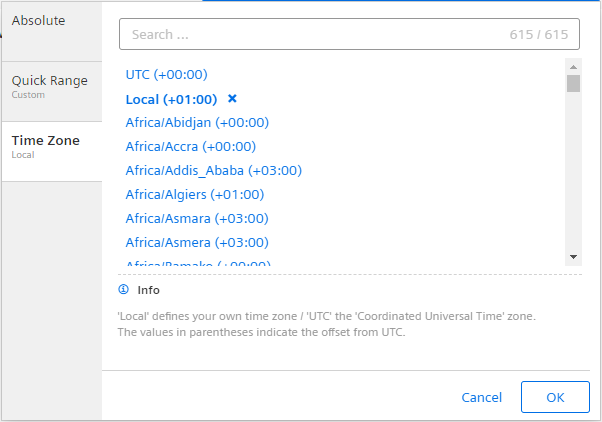
Time Zone: Allows you select the time zone.
Export Timeseries data
You can export the Timeseries data of your assets from the Timeseries plugin. Following functions are supported:
- Saving the exported data to a CSV or JSON file
- Selection of the desired aspects for which the data should be exported
- Selection of the desired time period
To export the Timeseries data, proceed with the following steps:
- In the "Timeseries" plugin for the selected asset, Click "Export".
- Select the aspects of your choice.
- Select the time period for which the data should be exported.
- Select the file type of your choice:
- JSON
or - CSV
If you select CSV type file, you can also define the delimiter.
- JSON
- Define the data point count limit for the file.
The maximum limit that can be set per file is 10000 count.
With the data point count you can influence the size of the exported file. - Click Start.
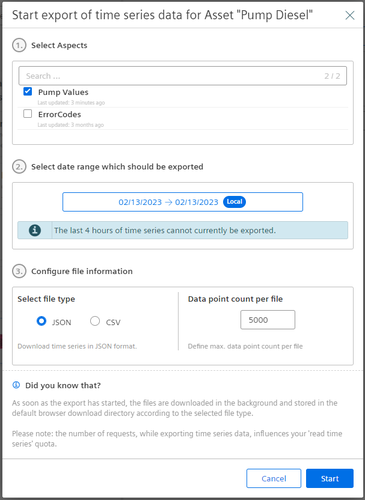
The file is downloaded by default to the standard download directory of your browser.