Timeseries user interface
The following screen depicts "Timeseries" user interface:
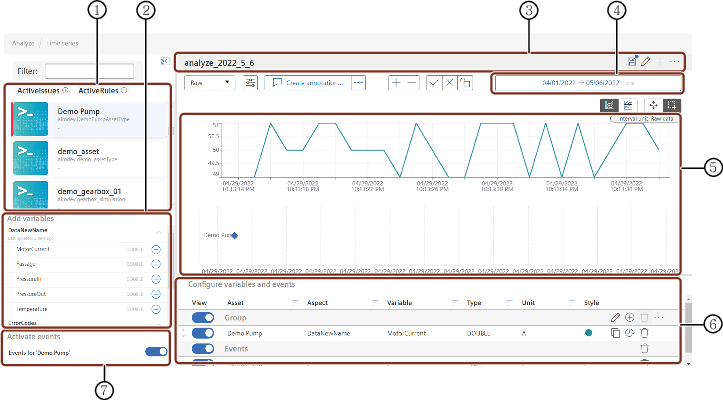
① Asset selection panel
② Variable selection panel
③ Analysis profile panel
④ Time selection panel
⑤ Data visualization area
⑥ Variable action panel
⑦ Event chart activation
By using the asset selection panel, you can select the asset of your choice to display the asset data in data visualization area. You can also add variables or events to your asset by using "Activate events" and "Add variables" buttons.
Last update: January 22, 2024