Event chart creation
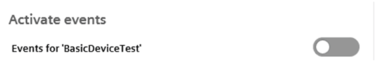
Event chart activation is used to display the events of the selected asset. Events can be displayed by the "Activate events" toggle button or by the toggle button available in the variable action panel of an asset. Once the events are activated, they will be displayed in the event chart of data visualization area.
The following screen displays "Activate events" toggle button:
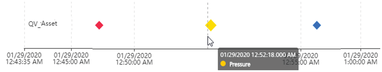
The following screen shows the events in the event chart:
Note
- In an event chart, maximum of 5 events can be displayed at a time.
- Events can only be activated, if they are not shared from another environment.
Last update: January 22, 2024