Assets
An asset is a digital representation of a machine or an automation system with one or multiple automation units (for example PLC) connected to Industrial IoT.
Insights Hub Monitor uses assets, aspects and variables as data model for its functions.
Aspects are combined, pre-configured data and form the context for the evaluation of industrial processes.
Asset health shows the active state and the historical state of an asset. You can automatically influence the asset health state with a rule, for more information on rules, refer to Rules. Asset health is currently only available for assets having an aspect named "status" of type 'core.assetstatus'. To achieve this, enable the action checkbox "Asset Status" in the rules wizard.
Asset Health status
Asset health shows the active state of the asset. Asset health is currently only available for assets having an aspect named "status" of type core.assetstatus.
You can influence the asset health state in several ways:
Asset Health via rule
You can set the asset state depending on the outcome of a monitoring rule, e.g. you may set the status to "Error" if an asset variable crosses a pre-configured threshold
- To achieve this, enable the action checkbox "Asset Status" in the rules wizard.
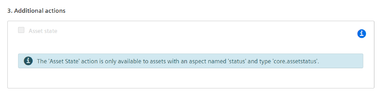 * The rule engine will set the configured status to the asset. * For more information on rules, refer to Rules
Asset Health via VFC (Visual Flow Creator)
The asset status can also be set by Visual Flow Creator node "Asset Status".
- To achieve this, configure the node in your workflow, and set the status as desired
- In this case do not configure a rule to set the asset status. As the rule would overwrite the status as determined by your VFC node
Asset Health via a custom application
You can also create your own application
- To achieve this, use the API to set the asset state as per the table shown below
- In this case do not configure a rule or VFC node to set the asset status, too. Otherwise the status as determined by your application code will get overwritten.
- For more information please refer to the Industrial IoT 'timeseries' API
- For more information on the allowed asset health values please refer to the table at the end of this page
How Asset Health status is shown within Insights Hub Monitor
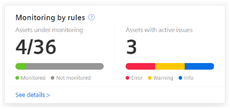
On the homepage you can detect easily the status of the monitored assets and get an impression about the health of your plant.
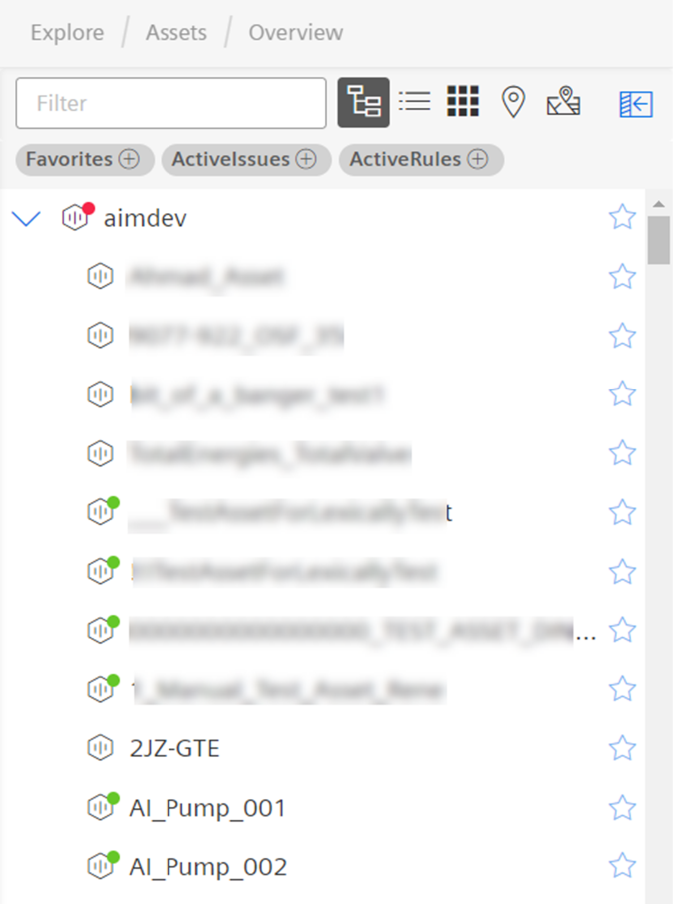
In the "Asset" view, the asset status will guide you quickly to the assets that need your attention. This is indicated via colored icons. Insights Hub Monitor will automatically aggregate the most relevant status to the highest concerned level.
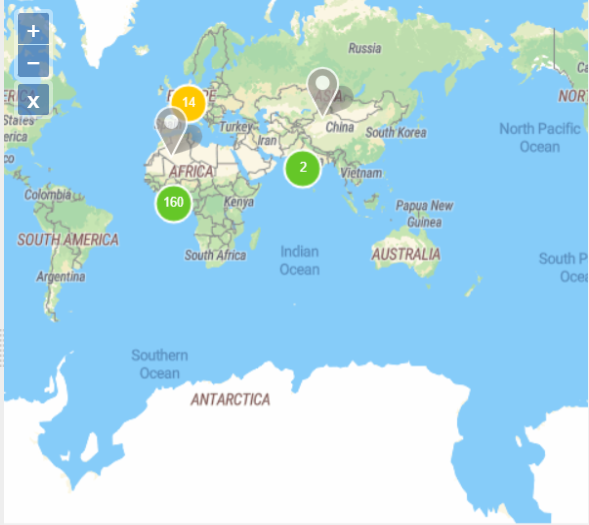
Also the map shows the status of the asset with colored pins:
Furthermore, the quick filters and the asset hierarchy tree on the "Assets" window helps you to easily find your monitored assets.
Asset Health status via custom code
The following table shows the valid values for asset health and their meaning:
| Asset-color | Error code | Status |
|---|---|---|
| Grey | 0 | Shows that the asset state is not monitored / Unknown |
| Red | 20 | Shows the "Error" asset health state |
| Yellow | 30 | Shows the "Warning" asset health state |
| Blue | 40 | Shows the "Information" asset health state |
| Green | 50 | Shows the "Ok" asset health state |