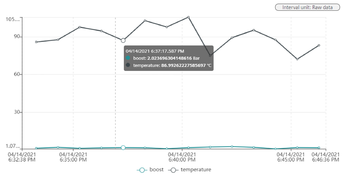
Analyze Graphs
The "Time Series" extension visualizes the time series data of the selected asset within a coordinate system. The line chart offers the following aids for analysis and display:
- Data values
- Selecting the data variables
- Zoom function
Showing Data values
To show the data values in the graph, move the mouse pointer over the lines in the graph. The vertical gray line shows the exact time on the time axis.

Selecting data variables
The variables of the time series data can be selected from the available variables section. The variables selected are saved per asset type in your user settings. If you switch to another asset of the same type, the same variables are selected as before.
To show or hide a variable in the graph, click on the variable below the graph.
Note
Maximum of 10 variables can be added to the chart.
Zoom Function
You have the possibility to analyze the graph with the zoom function. You can activate the zoom function by using the mouse wheel to zoom into and out of the graphs.
You can also use the zoom in or zoom out icons available next to the graph.