Adding Data Sources to Dashboards
Adding Data Sources to Dashboards Overview
This topic covers the first step in creating a dashboard—adding the data sources you want to use in your dashboard. You can mix and match different types of data sources on a dashboard, but can only use one data source type per widget.
About Adding Data Sources to Dashboards
Here are some features to be aware of, in general, when adding data sources:
- If the Widget Library is hidden, click the double-chevron icon to collapse the configuration tabs. Click to expand; Click to collapse.
- You can upload a new Integrated Data Lake (IDL) data source in the same window in which you select an IDL data source.
- As you select data sources, the names display in the Data Sources tab as hyperlinks, along with:
- Data source name.
- Data type—a badge displays to indicate the data source origin.
- A delete icon.
- The data source names that display on the Data Sources tab are hyperlinks. Click one to open the data source for viewing or editing.
- If you add a data source but don't have time to configure it or add it to a widget, Dashboards automatically saves it to the dashboard.
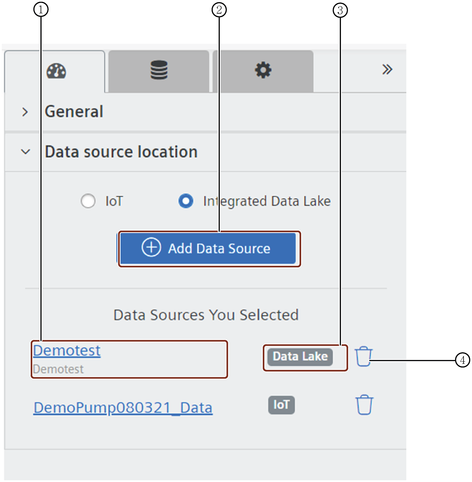
① Data Source names are hyperlinked. Click a name to open the View/Edit Data source page.
② Add Data Source
③ Badge indicate the origin of the Data Source.
④ Delete
How to Add an Integrated Data Lake (IDL) Data Source to a Dashboard
Dashboards is capable of reading data—unstructured and structured—stored in the Integrated Data Lake, and writing that data to your dashboard, where you can use it immediately in widgets, or you can configure the data with settings that can focus on specific attributes and values.
About Chart Widgets Based on Data Sources with a Relative Time Range
When you select auto-refresh for a chart widget based on the data configured with a relative time range (today, yesterday, last seven days, last thirty days, this month, last month), the chart widget will advance as time moves forward and the widget will be refreshed according to the relative time range.
How to Add an IDL Data Source to a Dashboard
Follow these steps to add an IDL data source to your dashboard:
- Click the "Add Data Sources" tab, then select the "Integrated Data Lake" radio button.
- Click the "Add Data Source" button. The Integrated Data Lake Data Sources window displays.
- Select the CSV radio button, then select the "folder" that holds the file you want to use on your dashboard.
- To see the file schema (optional), click the "filename". The schema displays to the right but is not editable in this window.
- Click the "Add Data Source" button. The pop-up window closes and the data source name displays in the Data Sources You Selected list.
- Repeat "steps 1-7" to add additional data sources to your dashboard.
Next Step: Adding widgets to your dashboard. Refer to "Adding widgets to your dashboard" for step-by-step instruction.
How to upload a new data source to IDL
If you need to use an IDL data source that you have not yet uploaded to the data lake, you can do so directly from the IDL window in which you select a data source. Follow these steps to upload a new data source to IDL:
- Navigate to the folder in the data lke where you want to upload the new data (see steps 1-3 in the section for adding an IDL data source).
- Click the "Upoad to IDL" button. The IDL Data Explorer window opens.
- Click "Upload Objects". Your File Manager window opens.
- Select the file to upload. The file name displays in the Upload Objects window.
- Click the Upload button. The system displays a Success message and the data displays in your IDL folder next time you open it.
How to Add a Time Series Data Source to a Dashboard
The IoT Time Series widget allows you to query and view time series data with precision to one millisecond. Dashboards can read IoT Time Series data from an asset and its aspects, and write that data to your dashboard, where you can use it immediately. This topic covers adding an IoT Time Series data source to your dashboard.
Follow these steps to add an IoT TS data source to your dashboard:
- Click the "Add Data Sources" icon. The Add Data Sources tab opens.
- Select the "IoT" or "Time Series" radio button.
- Click the "+Add Data Source" button. The IoT Time Series pop-up window opens.
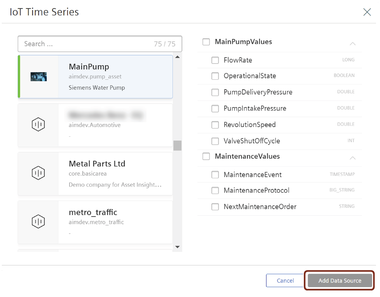
- Select or search for the "asset" you want to use. The aspects associated with the asset display in the list to the right.
- Select the "aspects" you want to use, or select the "check box" at the top of a list section to select all.
- Click the "Add Data Source" button. The pop-up window closes and the data source name displays in the Data Sources You Selected list.
- Repeat steps 1-7 to add additional data sources to your dashboard.
Click Adding widgets to your dashboard for step-by-step instructions on adding widgets to your dashboard.