View Issue Panel
If you want to find out more about a certain issue, you can click the “View” button on the specific item of the table. This will open a panel on the right side of the screen.
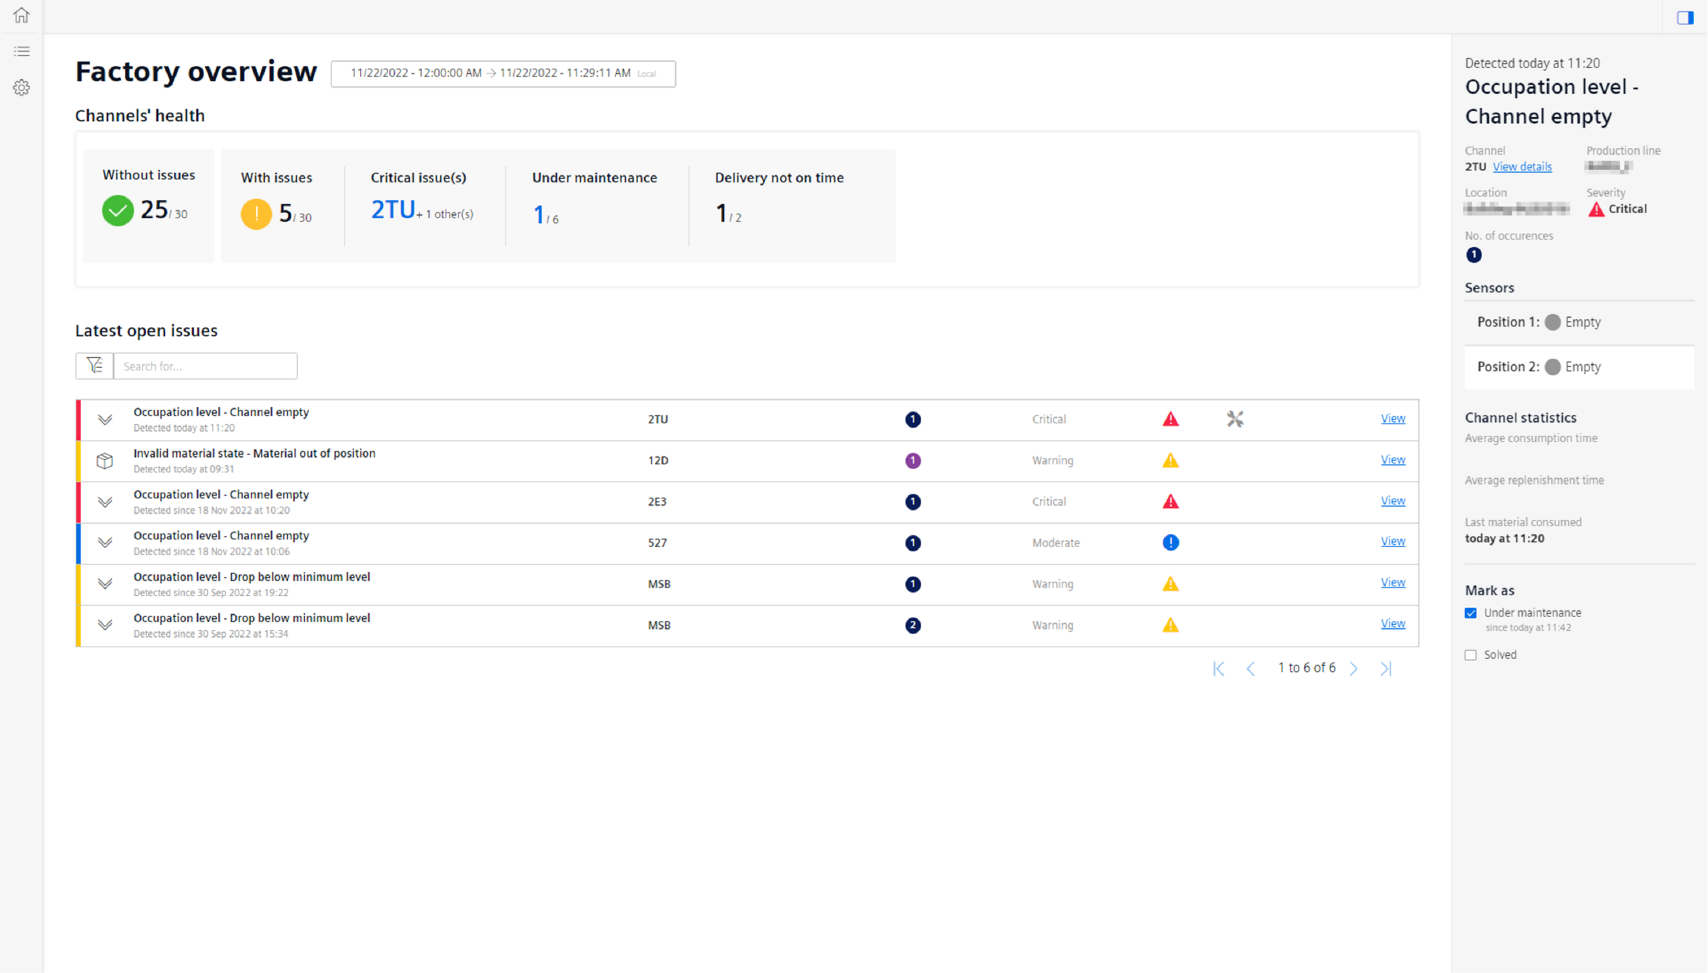
The side panel shows the following information:
- Timestamp of issue detection
- Issue Name
- Channel, on which the issue occurred
- Production Line Name
- Location
- Severity
- Number of occurences
- Sensor states when the issue occurred, in the screenshot you can see that position 1 and 2 were filled, and 3 and 4 were empty on the issue occurrence
- Channel Statistics with the channel average consumption and replenishment time
- Last material consumed
- Light Ticketing System – “Mark as”
- Under Maintenance: once you pick up an issue, you can tick the box and set the channel as under maintenance. Once you have resolved the issue a timestamp will appear under the check box and the following icon will be added to the table entry
 . In addtion the “Under Maintenance” counter in the KPI section above will be counted up.
 - Solved: Once you tick this checkbox the item will be removed from the open issues table. This can be used, if you want to acknowledge a certain issue or have actually solved it.
- Under Maintenance: once you pick up an issue, you can tick the box and set the channel as under maintenance. Once you have resolved the issue a timestamp will appear under the check box and the following icon will be added to the table entry
Last update: January 22, 2024