Material Channel Performance
In the next section, you will find two charts. One is displaying the consumption times over a period of time, and the second one shows the replenishment times. Both charts also have an average value associated.
The charts itself show the measured times over time, and not how the average developed over time.
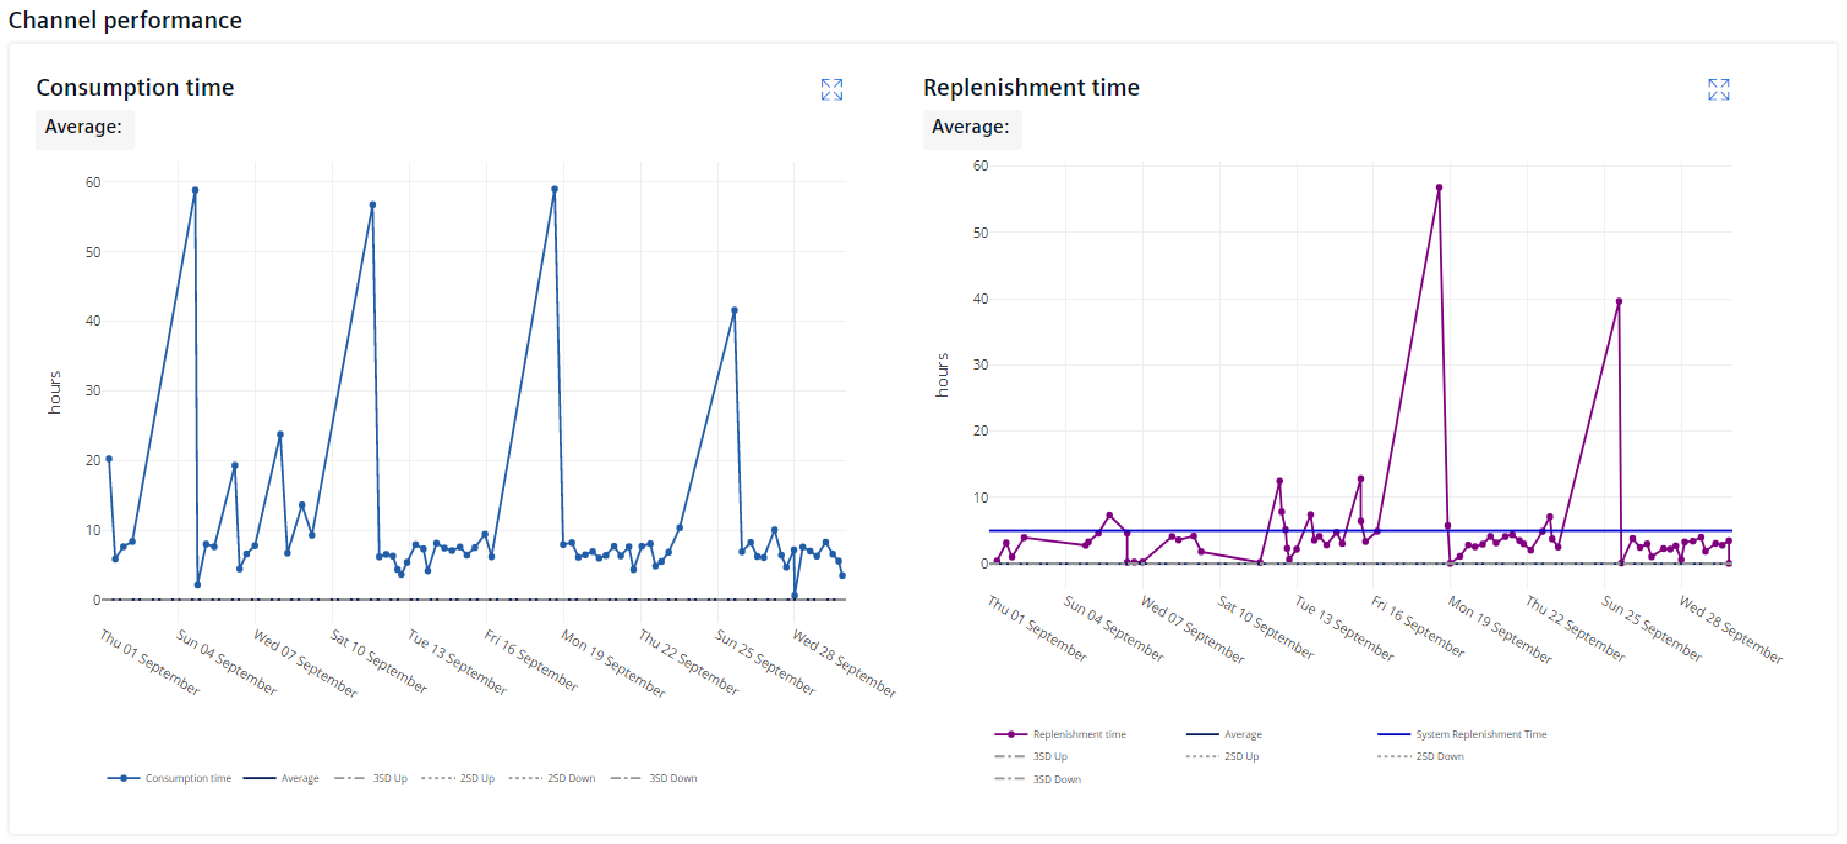
In addition to the measured times, you will also see additional lines in the chart:
- The calculated average value
- 3 times of standard deviation above and below the average
- 2 times of standard deviation above and below the average
- The replenishment time chart, also carries the system replenishment time
Both charts can be expanded by clicking the following button.
Last update: January 22, 2024