User interface
The following graphic shows the user interface of Insights Hub Edge Analytics:
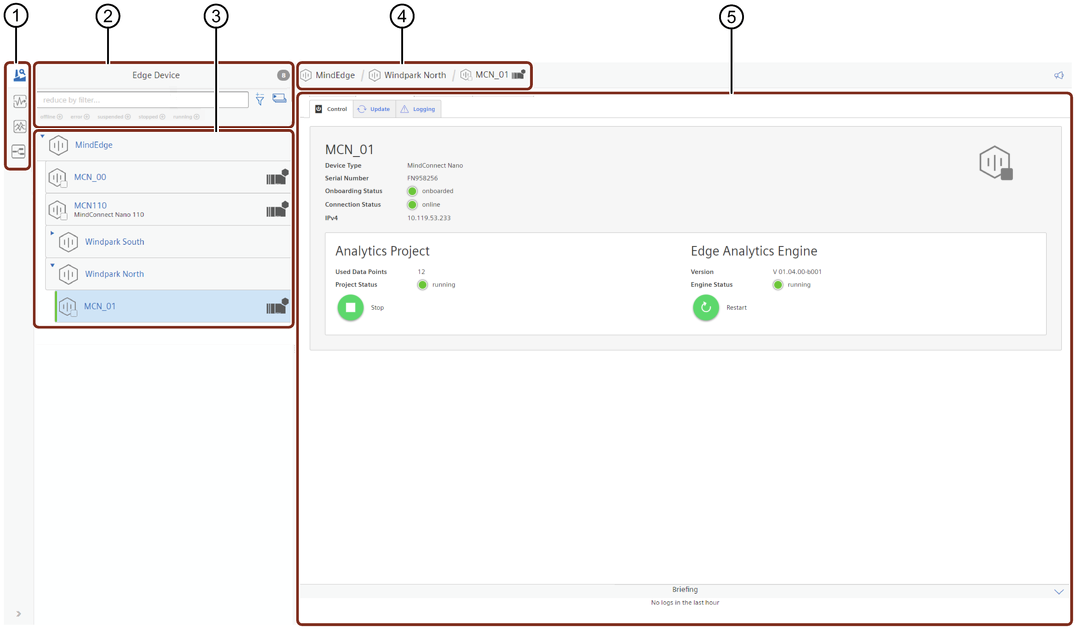
① Main selection
② Filter and Expand/Collapse operations
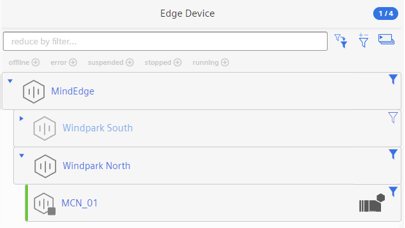
③ Tree View of Asset structure
④ Hierarchy path of the asset
⑤ Configuration area
Symbols
The following section shows the icons that may appear in the user interface:
| Symbol | Description |
|---|---|
| Shows that you need to update your configuration. A new version of the application requires your configuration to be migrated. | |
| Shows that configurations are available for upload. |
With the node filter it is possible to configure the shown nodes within the Tree View.

After activation of the filtering selection by clicking on the filter button, to be shown or not shown nodes can be selected by clicking on the filter icon directly at the node. The filter icon is shown bold for selected nodes, which shall be shown in the filtered view. All child nodes of a filtered node will receive the same filter status.
In case the filter selection is active and all nodes are selected to be shown, below icon can be used to deselect all nodes.
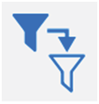
In case all nodes are deselected, below icon can be used to select all nodes.

The filter selection can be again left by clicking.
In case the filter selection has been left and a filtering is active, below icon will be still shown.
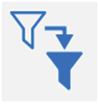
By clicking on this button, the complete filtering can be removed and all nodes will be shown again. Afterwards this button will also disappear.