Data Visualization
To visualize complex data such as Spectra, calculated and uploaded by Analysis Packages, a Complex Data Plugin is provided for Insights Hub Monitor. The plugin will be available as soon as the Insights Hub Edge Analytics application has been enabled for a target environment.
To visualize complex data, the corresponding aspect containing the uploaded data needs to be selected within Insights Hub Monitor and the complex data plugin needs to be opened. Subsequently, the complex data will be listed up for the defined time range and can be selected for visualization.
By assigning Components with containing frequency information to the Asset of the Spectra Analysis Package, Frequency Markers can be displayed to identify single frequency peaks as well as their harmonics. For information about creating and assigning Components, see Chapter “Components”.
The Complex Data Plugin allows selecting multiple spectra, to compare them with each other.
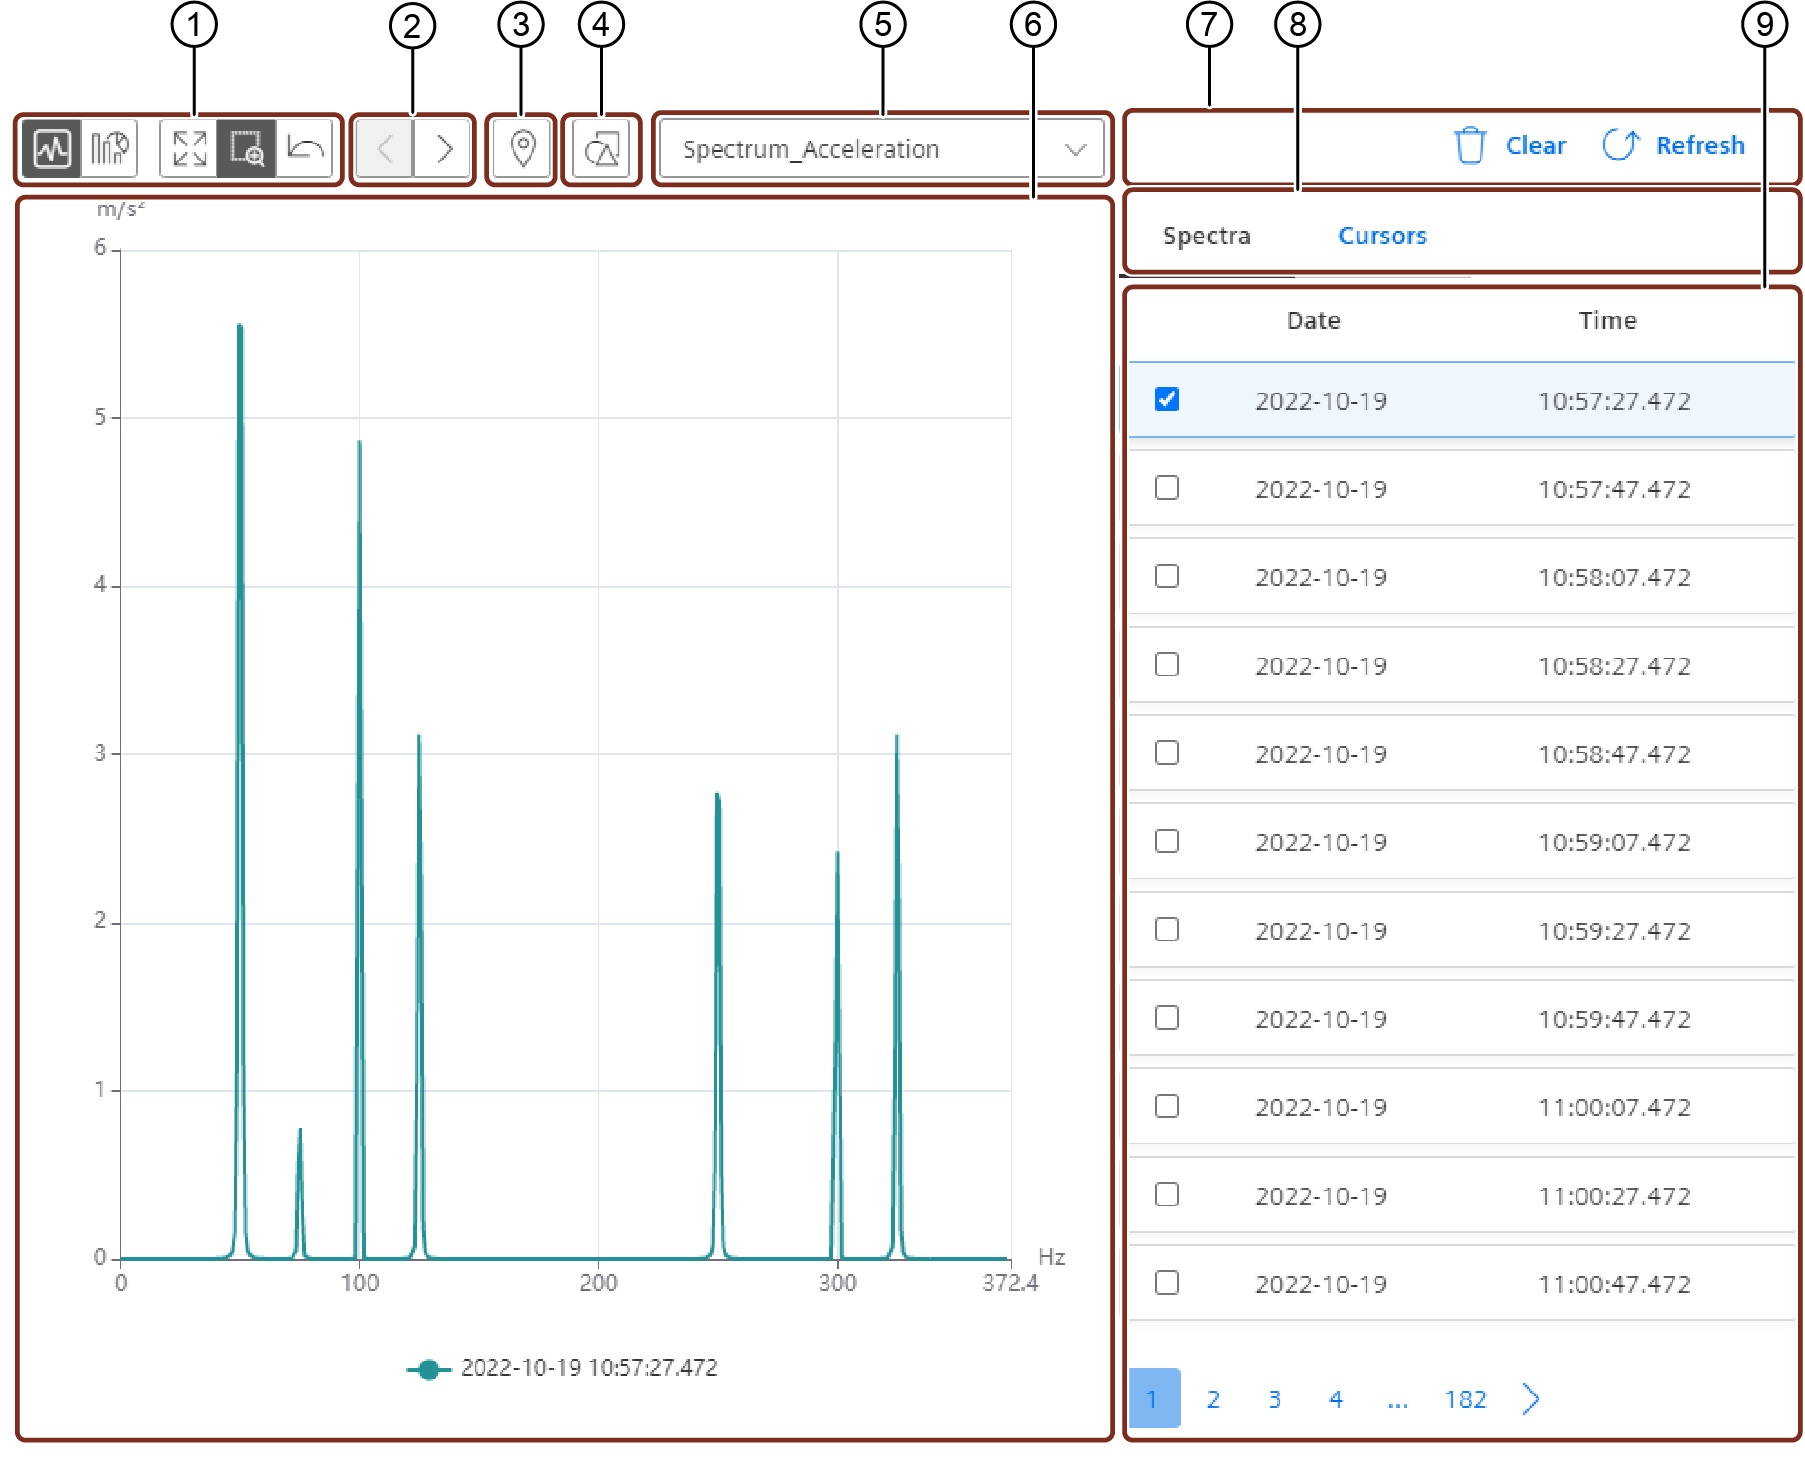
① Buttons for zooming/moving, undo zooming/moving, switch between a line or bar interpolation of the shown spectrum
② Buttons to select previous or next spectrum
③ Button to enable/disable cursors
④ Button to enable/disable value markers
⑤ Name filter for spectrum selection
⑥ Chart area
⑦ Buttons to clear spectra selection and to refresh selected time picker range
⑧ Tab selection for Spectra and Cursor options
⑨ List of available files
In case of assigned Components, the contained Frequency Markers can be displayed within the spectrum. In case the calculated spectrum was linked with a reference speed information in the corresponding Analysis Package, the speed frequency can be displayed as well.
It is possible to edit the position of the Markers, display harmonics and change the appearance. Changing the position can be done by entering a value or dragging the Marker to a new position.
Changed positions and settings are only applied for the selected Asset. If the value of a Frequency Marker needs to be changed centrally for the Components, this needs to be done within the Component Section of Edge Analytics.
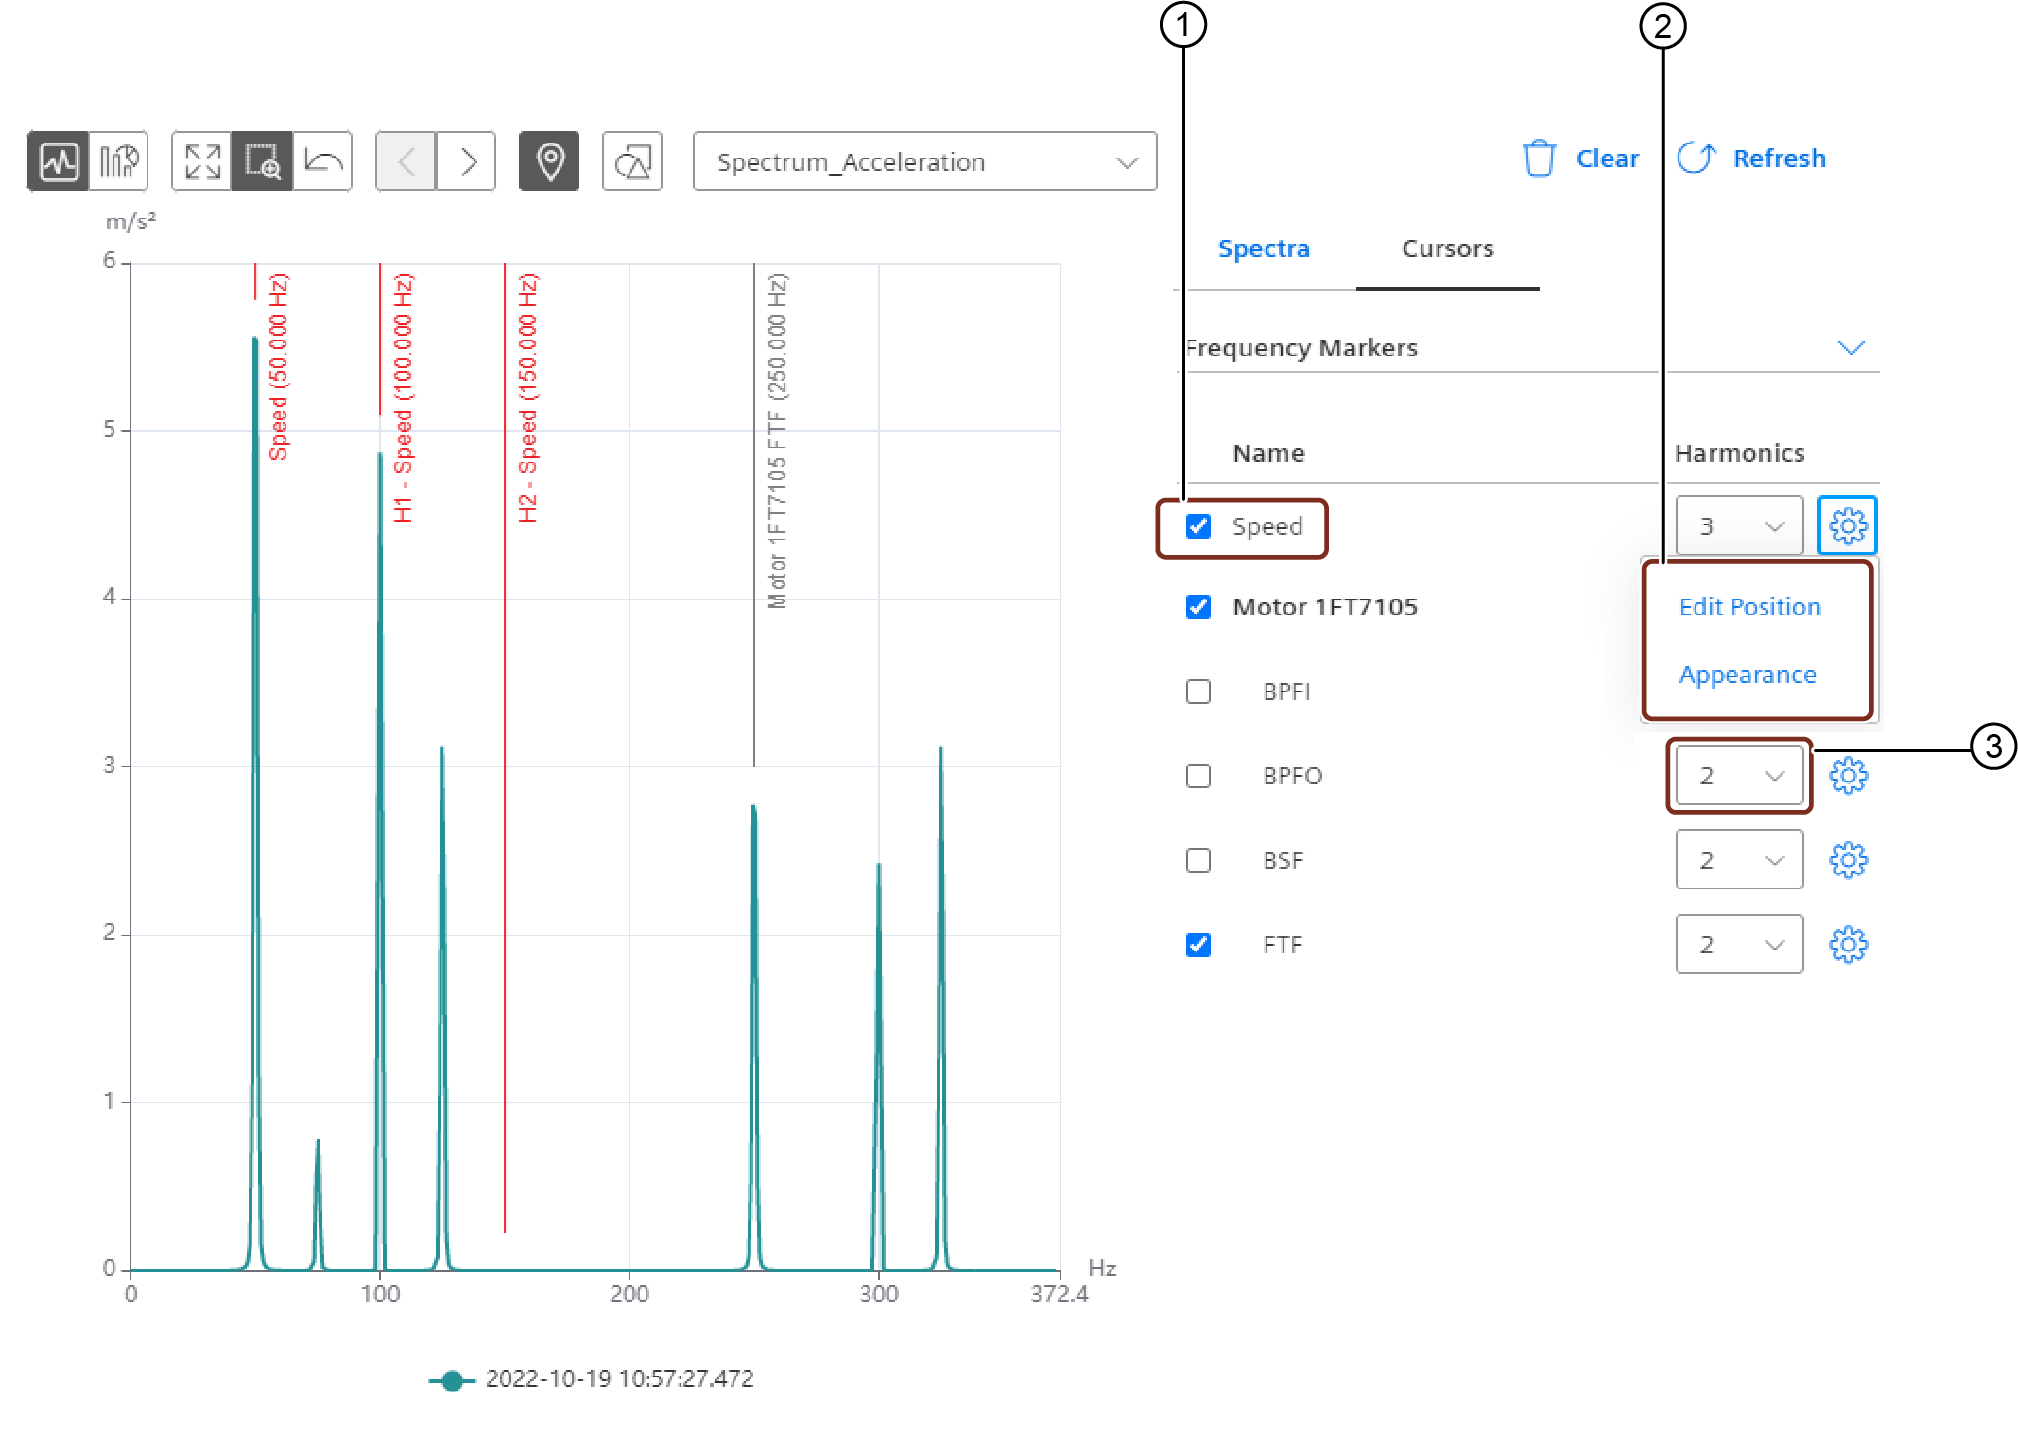
① Enable Button to show/hide the target Marker
② Settings Button to edit position or appearance
③ Number of displayed harmonics