Amplitude Trends
The Analysis Package Extension “Amplitude Trends” allows to extract the maximal amplitude of defined frequencies or orders from its calculated spectra and upload it as a timeseries trend. It is also possible to set the center frequencies based on the created components, which already contain frequency definitions.
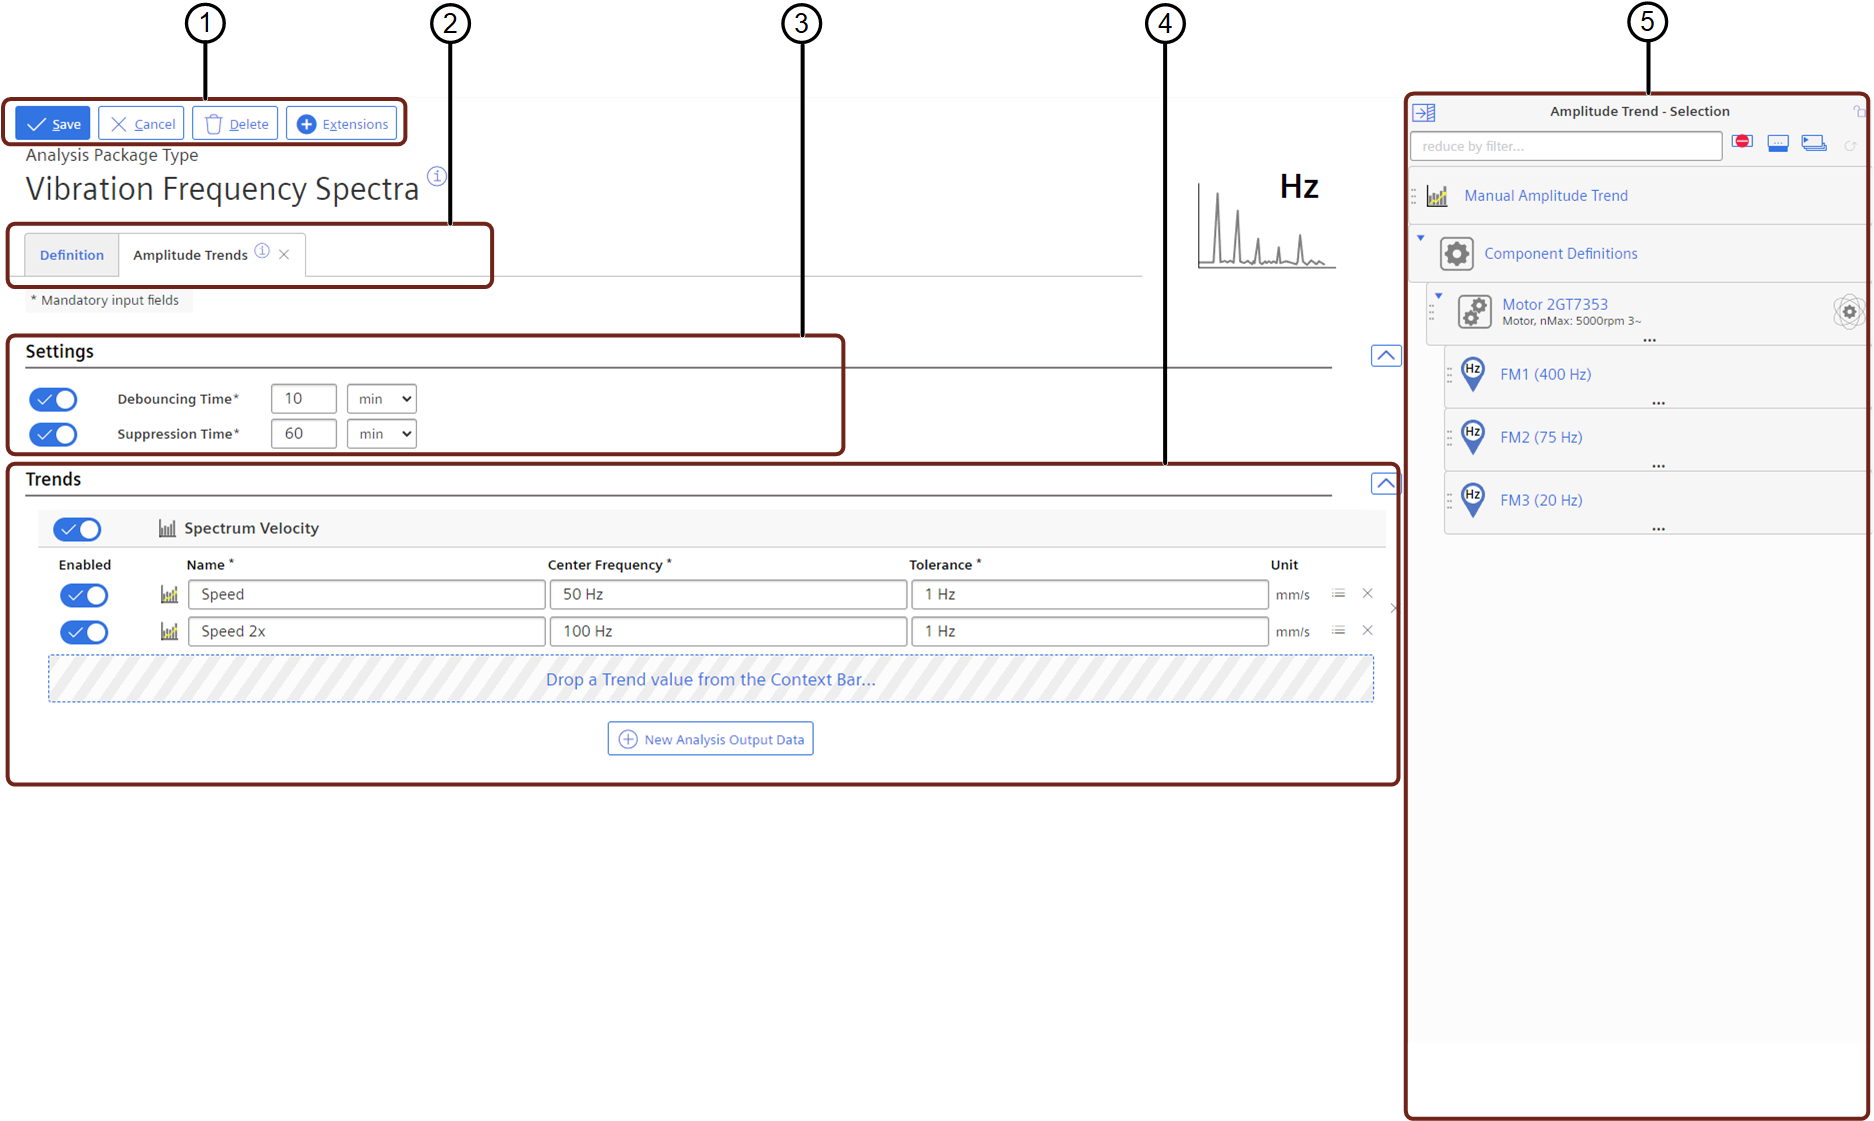
① Save or Cancel settings
② Extension selection tabs
③ Settings definitions
④ Amplitude Trend definitions
⑤ Context Bar with available spectrum types, trend type or Components
| Area | Parameter | Description |
|---|---|---|
| Trends | Name | Define the Amplitude Trend Name |
| Center Frequency | Define the Center Frequency from which the maximal amplitude shall be determined | |
| Tolerance | Define the Tolerance around the Center Frequency, to compensate for minor deviations of the frequency. The maximal Amplitude will be determined in a frequency band of: Center Frequency – Tolerance till Center Frequency + Tolerance | |
| Limit Check | Enable and define the limit check on the amplitude. If the menu button on the amplitude trend is clicked, a context bar appears, where it is possible to enable and configure warning and alarm limits | |
| Context Bar | Analysis Output Data | Shows the available data of the Analysis Package, which can be used for Amplitude Trend extraction |
If the limits are defined for one or more trends, a determination of the health status will be performed, and the settings for debouncing and suppression time are shown and can be set. On exceeding one of these limits, a corresponding health status is generated, uploaded to Industrial IoT, and can be monitored in Insights Hub Monitor.
The debouncing time can be used to suppress the event creation on exceeding limits. If the timeseries data settles back below a previously exceeded limit within the defined time, no event is created.
After an event has been created, further events will be dismissed for the defined suppression time if the suppression is enabled.