Tips and Tricks
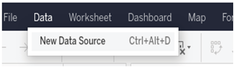
Adding Multiple Data Sources to one Workbook
Multiple data sources are included in one workbook. The navigation starts from one particular data source in the Insights Hub Business Intelligence and then a workbook is based on this data source and it is possible to add additional data sources to a workbook by selecting data from "New Data Source".
Using VFC to add Sample Data
Follow these steps to add sample data:
- In the Asset Manager, add an asset with a particular "Type".
- Write data to the asset from the Visual Flow Creator application and use the corresponding timeseries write nodes.
- Create a periodically updated data source in Insights Hub Business Intelligence Data.
Row-level Security
The data sources created by Insights Hub Business Intelligence Data enable Row-level Security. It protects against the ability to share dashboards among multiple users. Records in a data source belong to assets. Assets displayed on the dashboard are dependent on the logged-in Insights Hub user. This enables you to access different data from the same dashboard at the same time. An OEM can create a visualization for a fleet and transfer it to subtenants. The subtenants can access assets that are enabled for them.
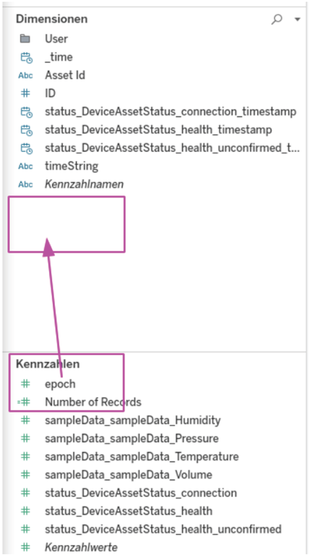
Dealing with Numeric Overflows
By default, Tableau® aggregates measure type values. With every Drag and Drop of a measure from the left side to the visualization, Tableau® tries to sum up the values. This is not convenient with multiple values and when a single value is not distant from the numeric limit of a variable type. For instance, many epoch time stamps may easily exceed the long integer data type. In this case, circumvent the aggregation by first converting the measure into a dimension. Drag it in the left panel from "Measures" to "Dimensions".
Update a Fixed Range Data Source
Switching between the update modes at any time is possible by editing the data source configuration. "Fixed Range" data sources are edited to update the time range of interest. Even without changes to the time range, the data source is treated as a new source and accordingly updated.
Dealing with a Limited Amount of Data
Insights Hub limits the amount of data per data source, as the Tableau® server cannot optimize too much data at the same time. The user interface shows the upper limit of records per data source. Processing a data source requires some time and for some frequencies, different limits apply in the continuous mode. These are listed in the user interface. However, in some cases these limitations may be too conservative. The Insights Hub Business Intelligence provides a way to override the limitation, refer to Choose update mechanism. The higher limitations are feasible in the particular use case, it is not guaranteed that the data transformation process will finish in time. You need to verify whether the update performance is still within the tolerances of the dashboard. To work around those limitations, the following points are emphasized:
- Pre-processing the data with a different tool such as Visual Flow Creator.
- Selecting a shorter time range.
- Dividing the data into multiple sources: one source with much data, but low frequent updates, and another data source with only the latest data, but higher frequency.
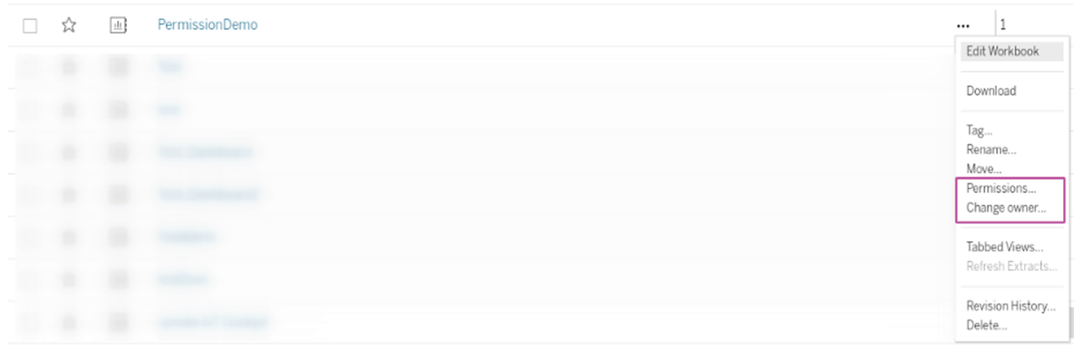
Collaboration
The ownership of a workbook lies with the creator. This means that nobody other than the creator can introduce any changes. To change this, the creator must explicitly set permissions. There are two ways to do this:
- Workbook ownership can be transferred to another user.
- Fine-grained permissions can be assigned.
Both options are available in the corresponding menu in the workbook list.