Introduction
System Manual  
Insights Hub Business Intelligence is used to create custom visualizations from the Insights Hub data, including IoT Time Series, Events, Integrated Data Lake (IDL) or Data Contextualization (DC).
The application is built on Tableau®, a leading platform in descriptive analytics that makes it easy to build graphical representations of data that are used to explore patterns, analyze business performance and enable collaboration on data. Multiple data visualizations are integrated in a single shared dashboard, where users can apply their own filters and interact with the data by adding their comments directly on the dashboard.
Example Visualization
The combination of both IoT Time Series and Integrated Data Lake files are displayed in this example to view the manufacturing costs associated with each production process, product type and order.
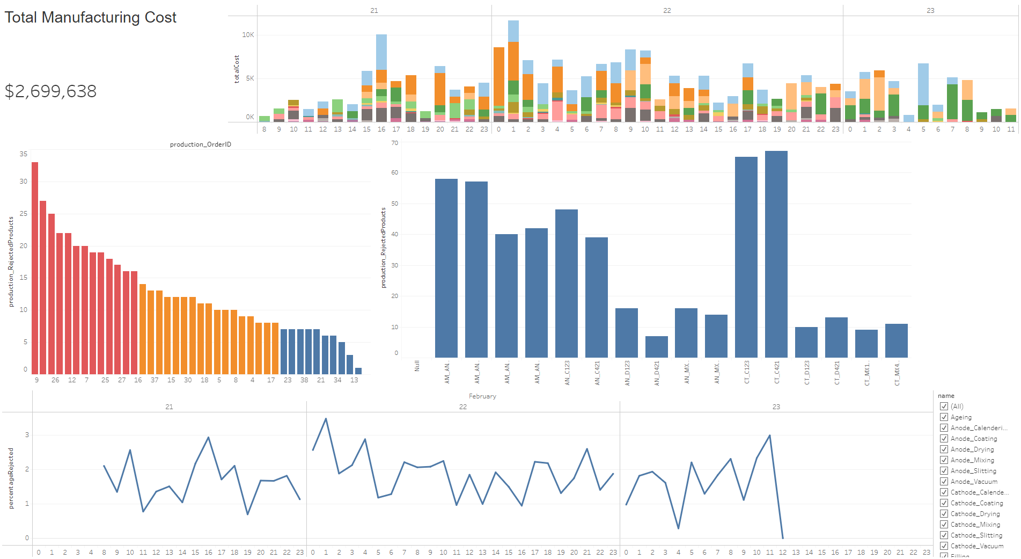
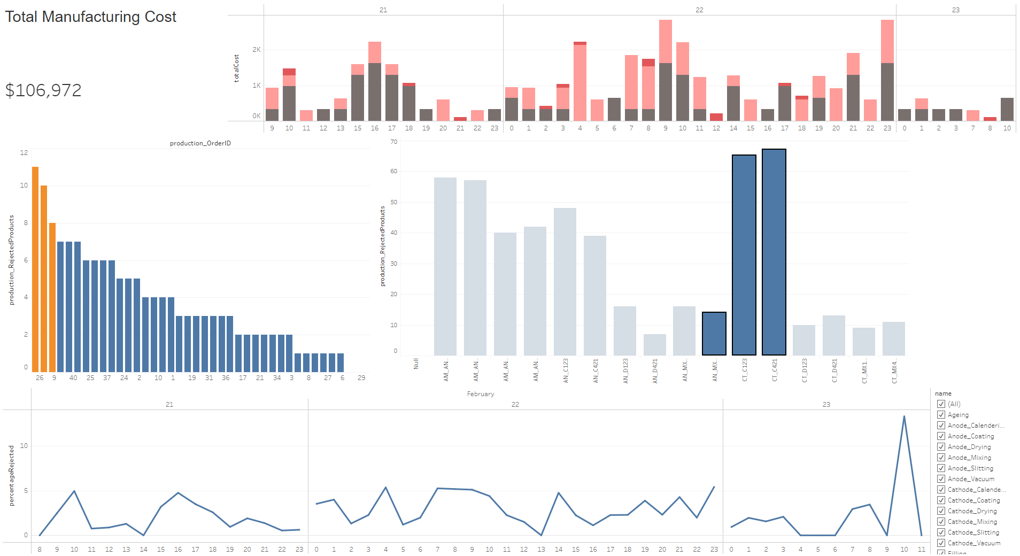
Every component of this dashboard is used as a filter to display only the data related to a specific attribute. For example, this can be a product, an order or a time range.
Subscriptions
You can configure the subscriptions or data-driven alerts to receive notifications or the entire dashboard in your inbox. 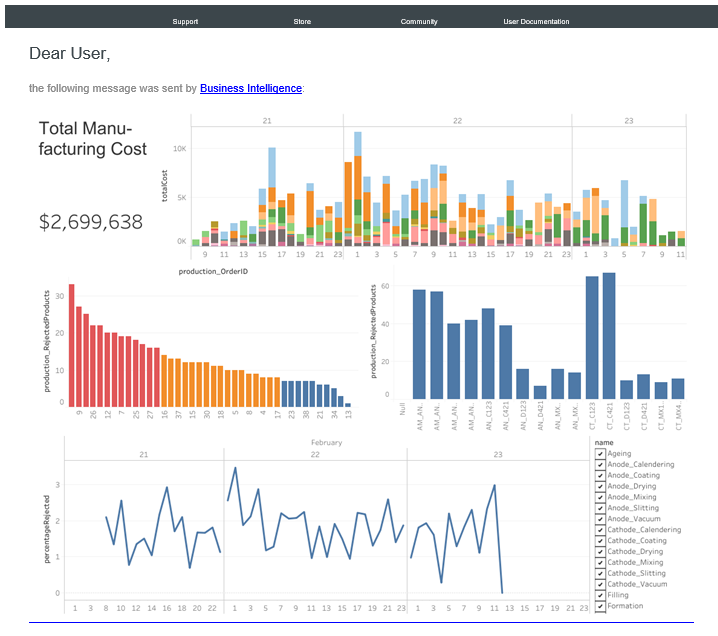
This documentation focusses on how to configure data sources from Insights Hub using the Business Intelligence Data application. These published data sources are used in the Business Intelligence application to create the visualizations. For more information on how to create the visualizations for your use case, refer to Tableau® documentation Creating Visualizations.
Note
Insights Hub Business Intelligence is not applicable for Azure VPC.