Time series data
"Time series data" extension allows you to visualize the signal data based on time in order to analyze the possible cause impacting the machine downtime. The "Time series data" extension supports the datatypes which have been defined for this asset type for the visualization of the variables of each aspects. The data of the signals are displayed in the chart view as line diagrams.
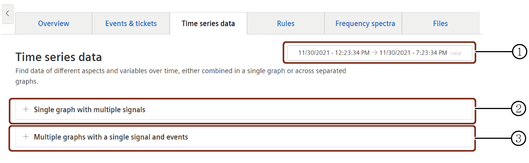
① Timepicker: Selection and specification of the time zone and the time period of the visualization
② Visualizes the multiple signals in single graph
③ Visualizes the individual signal in multiple graphs
This extension supports the visualization of the signal data of the assets for the configured variables in the following ways:
- Single graph with multiple signals
- Multiple graphs with a single signal and events
Visualizing multiple signals in a single graph
Time series data extension allows you to visualize the signal data of all the variables configured for the asset in a single graph to compare the variations at once.
To visualize the data, proceed as follows:
- In the "Time series data" extension, click "Single Graph with multiple signals".
- Select the variables to be visualized.
- Select the required time period from the timestamp.
The graph for the selected signals is displayed.
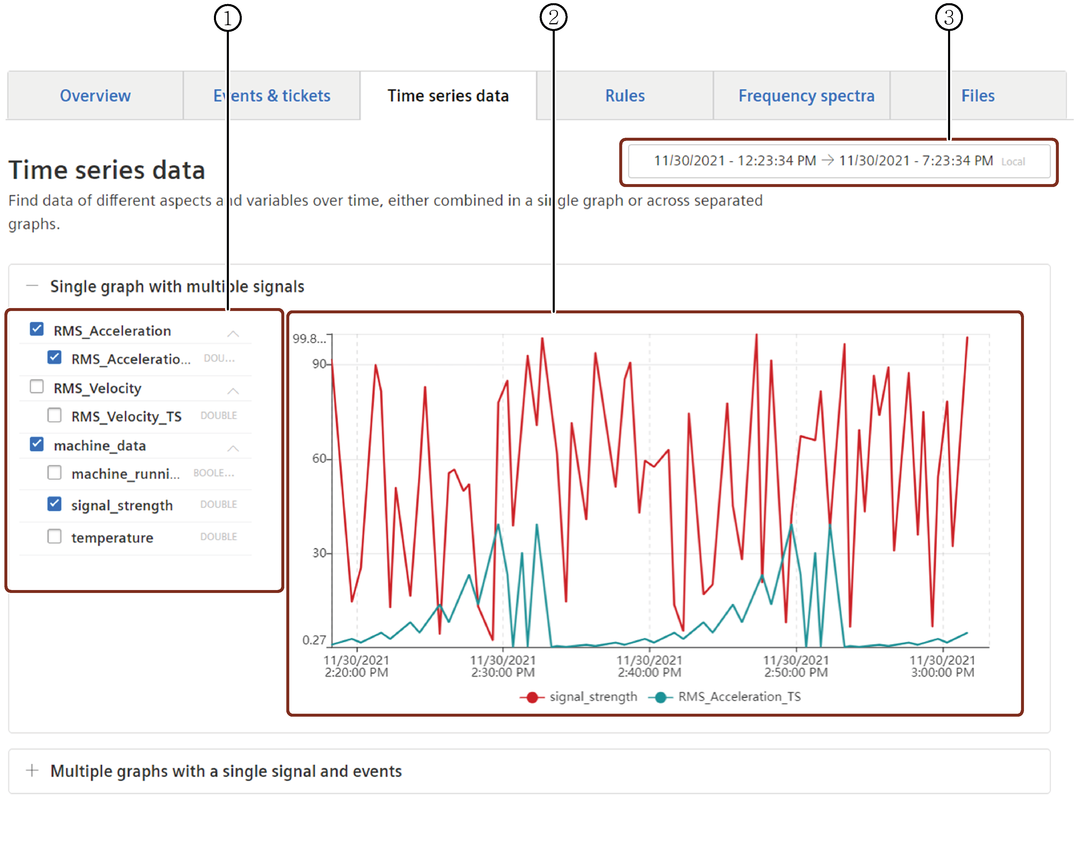
① List of variables of this asset
② Data visualization area
③ Timepicker: Selection and specification of the time zone and the time period
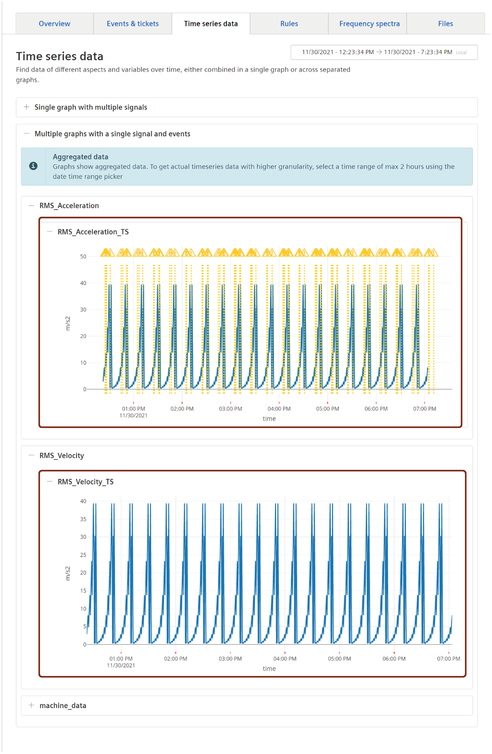
Visualizing Individual signal and events in multiple graphs
"Time series data" extension also allows you to visualize the signal data or events of the individual variables separately.
To visualize the data, proceed as follows:
- In the "Time series data" extension, click "Multiple graphs with a single signal and events".
- Select the variable to be visualized under the aspect of your choice.
- Select the required time period from the timestamp.
The graph of the selected variable is displayed.