Viewing Timeseries and Events
For any asset configured for a specific Digital Twin Model, the timeseries data can be viewed in "Workbench" in the "Assets" tab.
User interface
The user interface of "Assets" is as shown below:
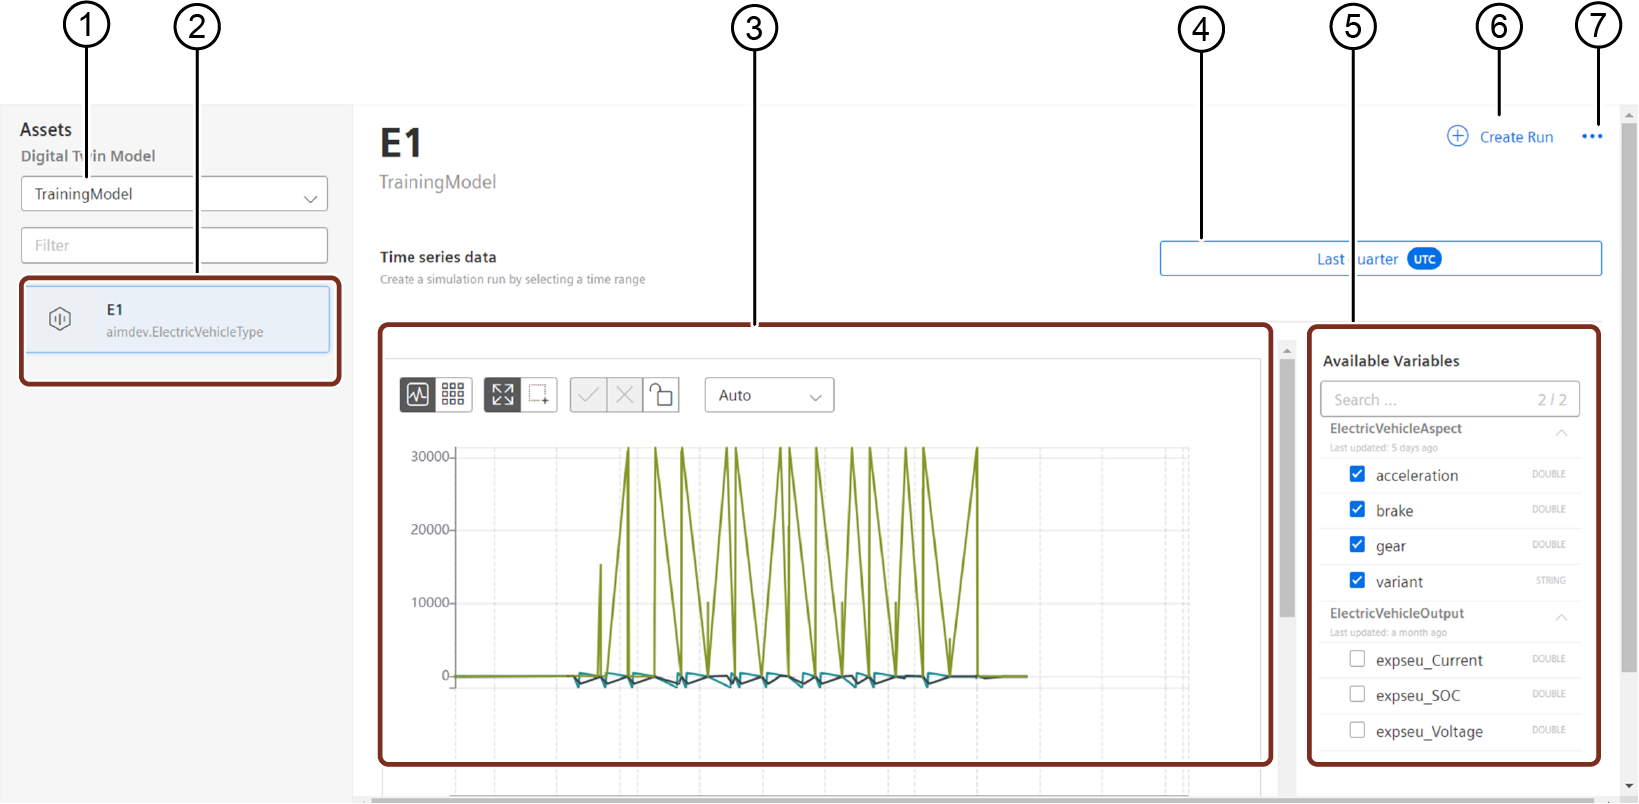
① Displays the available Digital Twin Models
② Displays the configured assets for the selected Digital Twin Model
③ Displays the timeseries and events data
④ Date and time picker to select the timerange
⑤ Available variables
⑥ Creates a new run
⑦ Creates a batch simulation
Viewing timeseries data and event details
To view timeseries data and event details for a specific time range, proceed with the following steps:
- In "Factory Twin", select "Workbench" from the left navigation and click "Assets".
- Select the required Digital Twin Model from the drop-down.
- Click on any configured asset for that Digital Twin Model.
- Select the required date range from the date picker, and enter the time in "Add time" field.
The date range can be selected either by manually selecting the dates in the "Absolute" menu, or by selecting the available date range from "Quick range". The following ranges are available:- Last 60 minutes
- Last 24 hours
- Last 7 days
- Last 30 days
- Last 90 days
- Today
- Yesterday
- Last week
- Last month
- Last quarter
- Select the variables from "Available Variables" section.
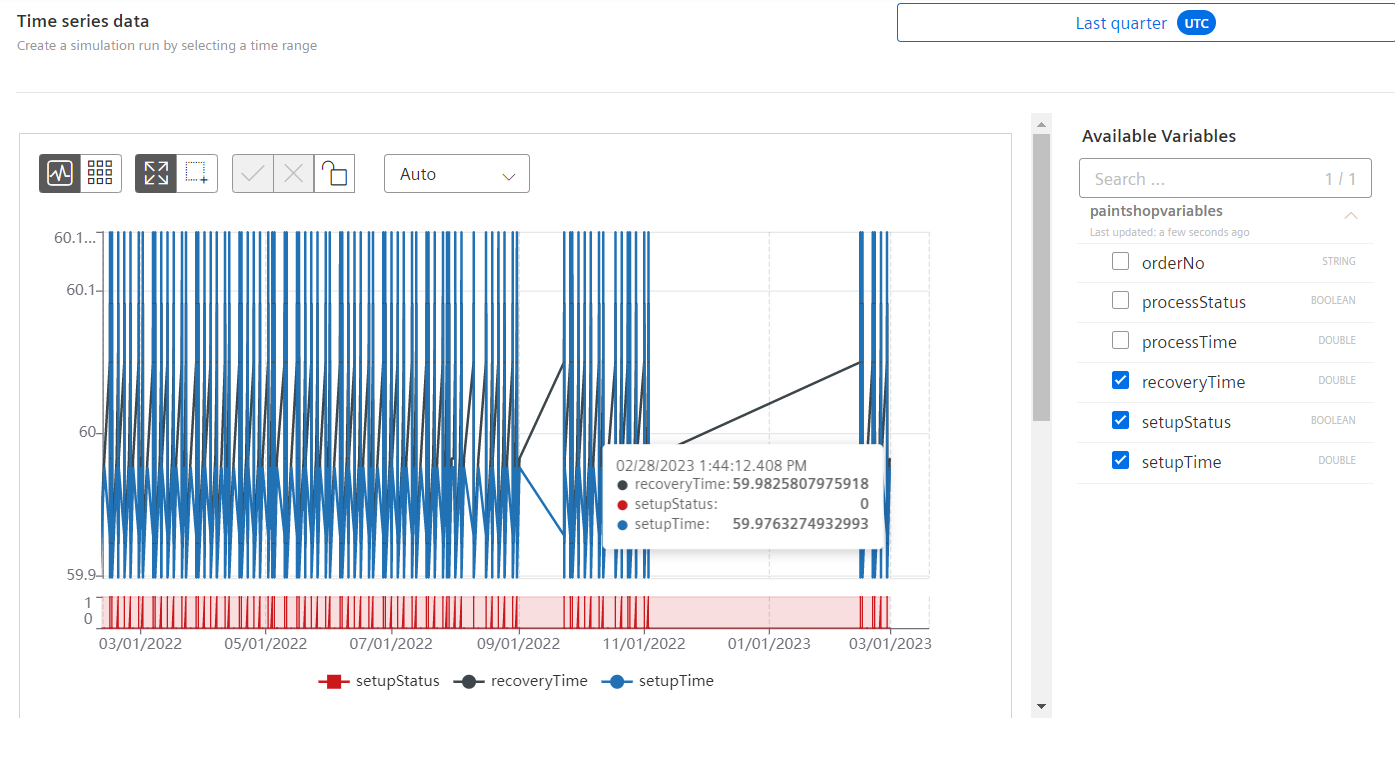
- Once the data is visible in the chart, you can perform any of the following actions by using the icons available to the right of the graph:
 - Display the results as chart
 - Display the results as a table
 - Move the selected time range by dragging over the chart
 - Select a different time range by dragging over the chart
 - Apply the selected time range
 - Reset the selected events from chart
 - Reset the selected time range from chart
Select the type of data to be displayed from the drop-down: Auto, Raw or Aggregates.
In addition, the events for the selected time period is also displayed below the graph. On clicking a specific event, the runs information is displayed. Also, the selected event is depicted in the graph.
You can create a new run by clicking "Create Run". For more information on creating a new run, refer the chapter Creating and viewing a Simulation Run.
Result
- The data is displayed for the specific asset for the required selected date range.
- The events and the event details for the selected event are displayed for the selected time range.
