Creating and viewing a Simulation Run
User interface
The user interface of "Simulation Runs" is as shown below:

① Filter the simulation run based on Study, Status, Modified After and Modified Before fields
② Select the required Digital Twin Model
③ Displays the list of available Simulation Runs
④ Creates a new simulation run
⑤ Deletes the selected simulation run
⑥ Displays the simulation results for the selected simulation run
⑦ Displays the details for the selected simulation run. In addition, the configured Dashboard URL is displayed. Click on the URL to navigate to the respective Dashboard.
⑧ Displays the options for download, Rerun and refresh the run
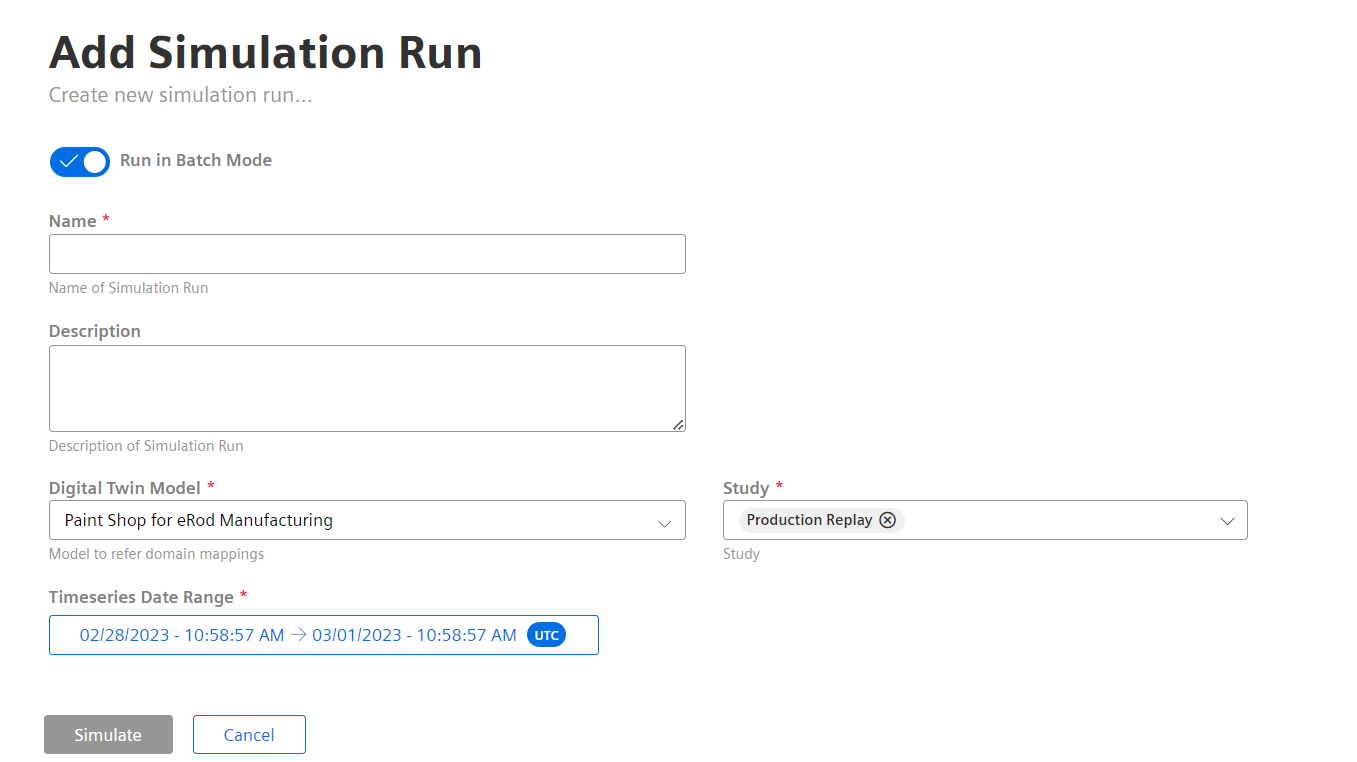
Creating a new run
To create a new Run for an existing Study, proceed with the following steps:
- In "Factory Twin", click "Workbench" and select "Simulation runs".
- Select the required Digital Twin Model Name from the drop-down.
- Click
 .
. - Enter the name and description for the new run.
- From the drop-down, select the Digital Twin model, and Study/Studies for which the run needs to be created.
- Select the "Timeseries Date range" form the date picker.
- Click "Simulate".
Batch mode creates a schedule to run simulations periodically either in batch mode (no manual intervention) or interactive mode. If "Run in Batch Mode" toggle button is enabled, the simulations will be executed in non-interactive mode. It also imports the HTML report of the simulation which can be viewed in the application
You can download, rerun or refresh the run by clicking ![]() .
.
Note
- The application displays an error if the following conditions are not met:
- If the Run name is not unique
- If non-numerical value is entered in nano seconds
- If there is no time-series data to export
- A Run cannot be created if a Digital Twin Instance is not available for a Digital Twin Template.
Viewing charts and reports
For any asset configured for a specific Digital Twin template, the Runs data can be viewed in "Workbench" in the "Simulation Runs" tab.
The created runs are listed in the "Simulation Runs" tab of the "Workbench" screen. The runs can be in any of the following states:
| States | Color codes |
|---|---|
| Pass | Green |
| Submitted | Yellow |
| Error | Black |
| Failed | Red |
To view the simulation results, click on the required Run and select the type of Simulation result. The available options are explained below:
-
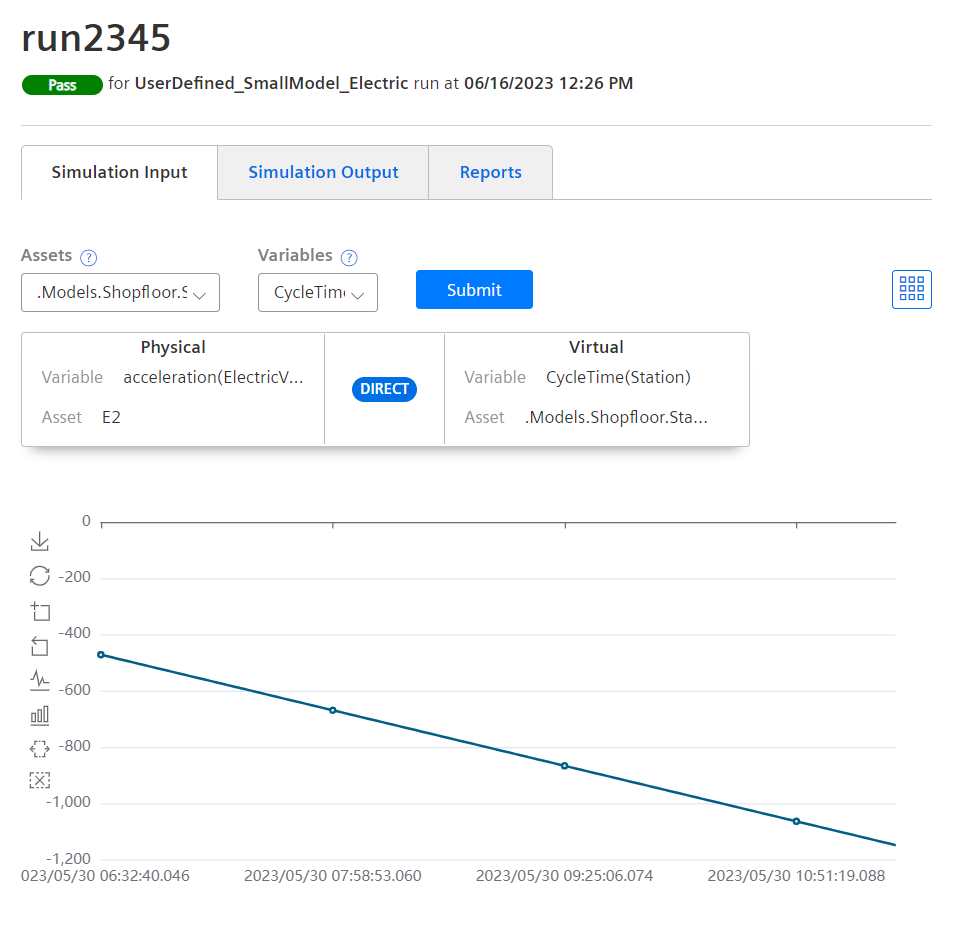
Simulation input: To view simulation data in chart or table view, click "Simulation input" tab. Select the Assets and Variables and click "Submit". In addition, the physical and virtual variables and the respective assets are displayed.
-
Simulation Output: To view the Simulation output data, click "Simulation Output" tab. Select the required assets, run results and the run results category. Click "Submit". The Simulation Statistics data is available for Pass and Failed Simulation runs.
The result is as shown below: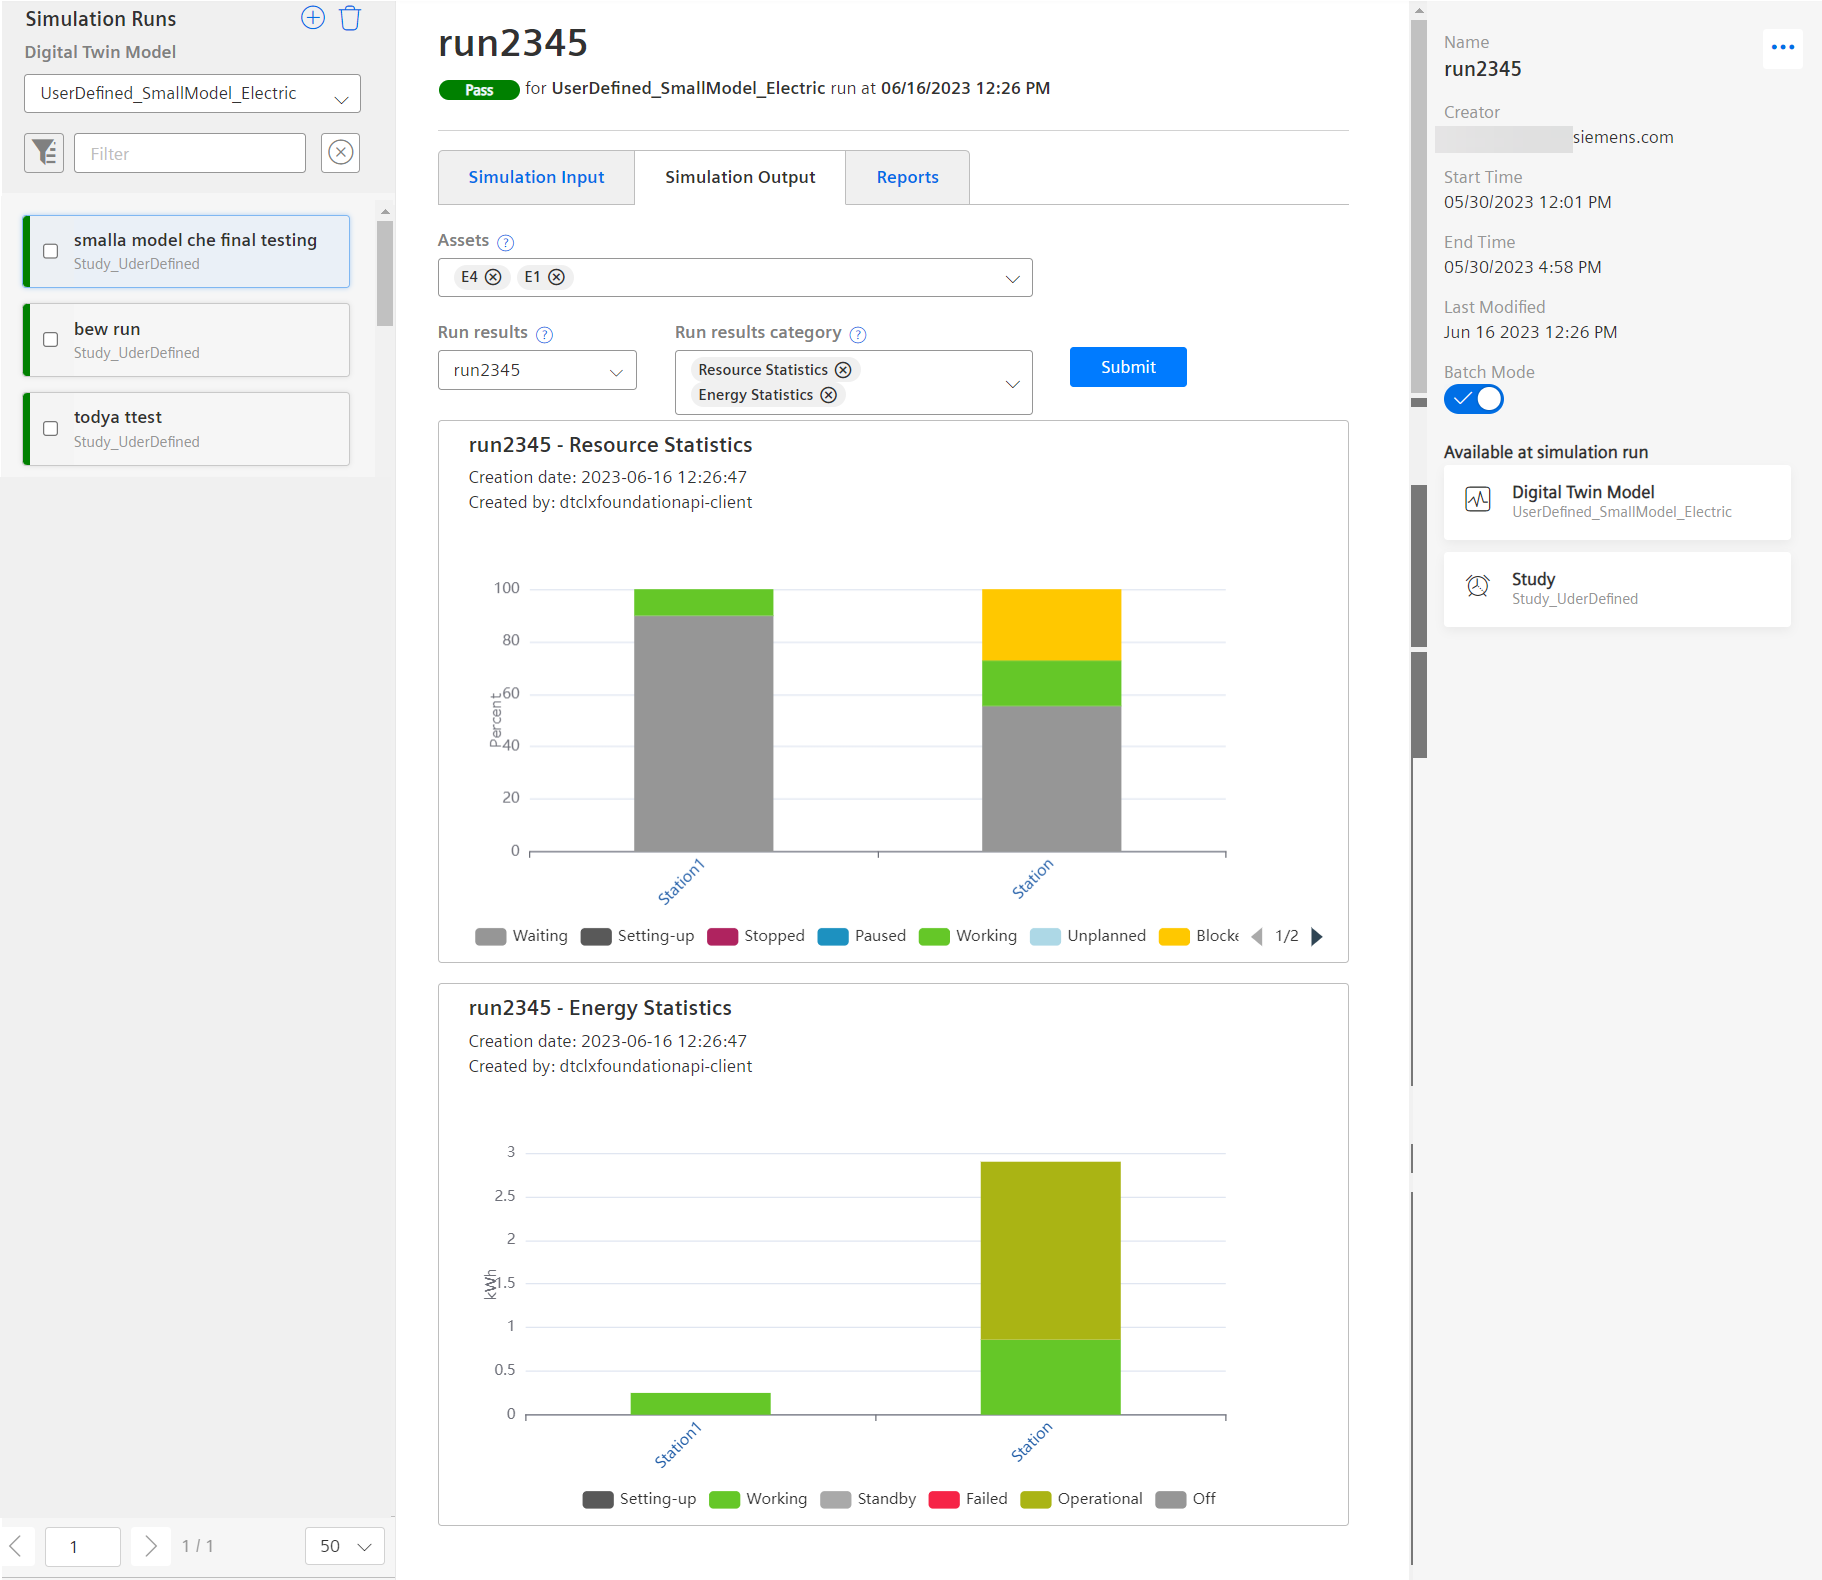
-
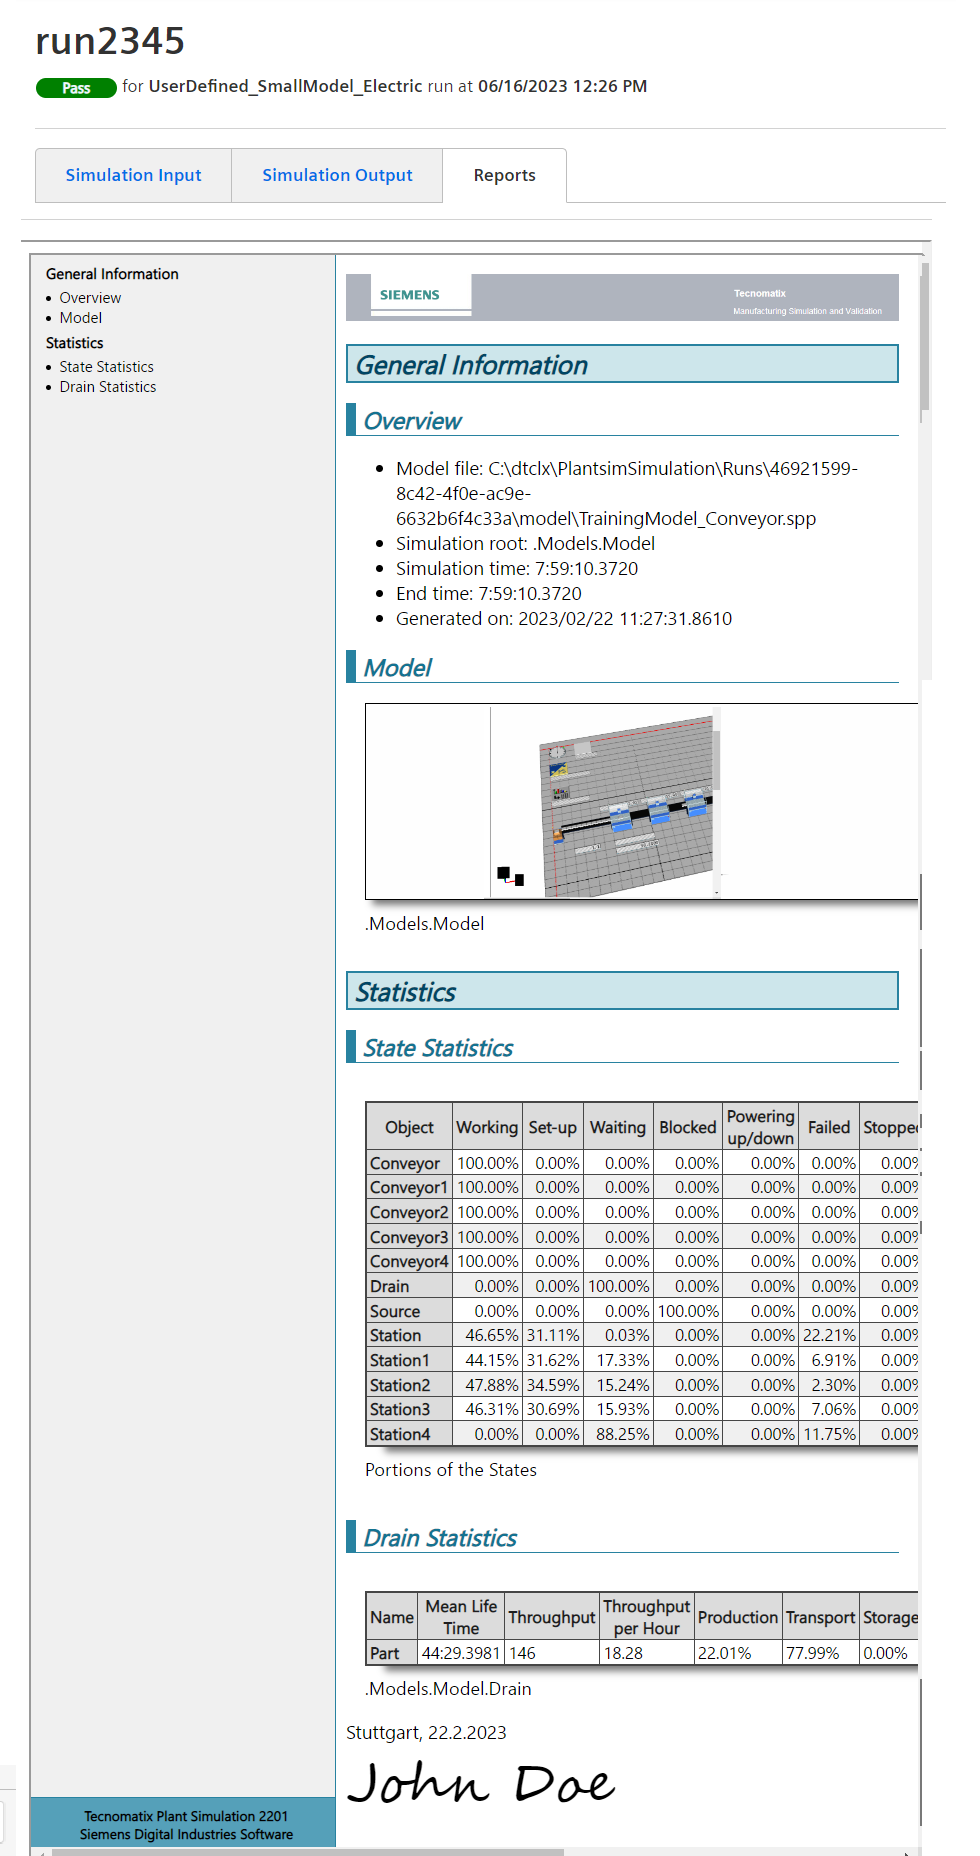
Reports: The reports tab displays information about Simulation statistics. The HTML report is available for Pass and Failed Simulation runs. On clicking the "Reports" tab, the report is displayed as shown below:
In addition, you can Download or Rerun the run by clicking ![]() at the top right corrner of the page.
at the top right corrner of the page.
To delete a run, select the run/runs by clicking on the checkbox next to that run and click ![]() . You can select multiple runs and delete them in one click.
. You can select multiple runs and delete them in one click.