Dashboard Designer Add On Functions
Functions in Dashboard Designer Add On are used to associate or transform raw data into useful formats for creating meaningful dashboards. Functions only display when you select Insights Hub or Default data sources.
Data requested by Dashboard Designer Add On is automatically aggregated by default. If your raw data must be queried in a different way, use the Functions feature to modify the query. Functions appear when you select a "Insights Hub" or "Default" data source. Functions you add to a query will override default Query settings.
Note
Dashboard Designer Add On is not available for Private Cloud.
Functions Overview
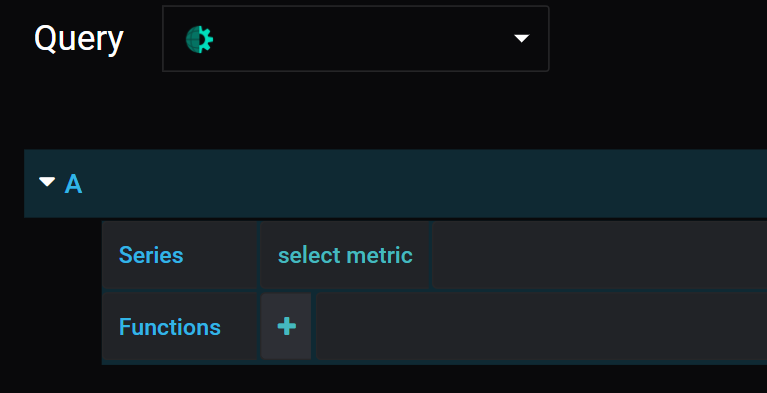
A query can have multiple functions and you can access them by opening a panel and navigating to the Query page:
Adding a Function to a Query
When you build a query, you can add functions to it by hovering over the + symbol. Click the + symbol to open a scrollable drop-down list of functions. You can add multiple functions to a single query.
How to Add Functions to a Query
Follow these steps to add a function to a query:
- Click the + icon next to "Functions".
- Hover over the data source name ("Insights Hub") and select a function from the drop-down list.
Removing a Function from a Query
Click a function name to open a pop-up window, and select "x" to remove a function.
Getting Help on Using a Function
Click a function name to open a pop-up window, and select "?" to see information on the function.
How to Create an Alias for a Query String
In graphs and charts, each variable displays the full query string in the legend. Queries are usually long and can clutter up the legend, so the alias function allows you to substitute a short name for the query string.
Syntax: alias(QUERY, alias)
Follow these steps to create an alias:
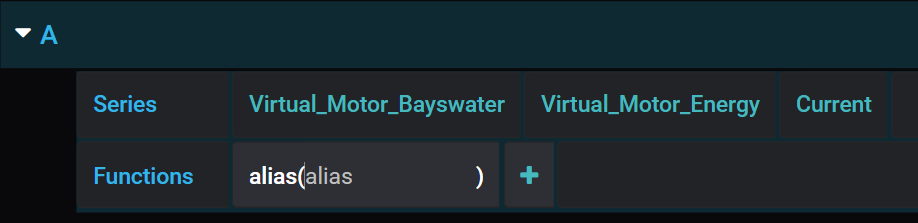
- Create a query and select alias from the list of functions. The tag 'alias' displays in the function row and a text cursor displays inside the bracket.
- Enter inside the brackets the alias you want to use for the variable.
To change the name again, click the text inside the brackets. Spaces are ignored but underscores can be used.
Note
If you deselect the function before typing anything inside the brackets you will have to remove the function and add it again to rename the variable.
Dashboard Designer Add On Functions and Syntaxes
This section describes the various functions available, when to use each function, and gives examples where helpful.
Alias
For single variable queries, renames a series to the user's input.
Syntax: alias(QUERY, alias)
AliasByName
For multi-variable queries, renames a series to the user's input; use it when you want to call an entire aspect. Add * as the final query in the string to return all aspect variables; in this scenario, the function will rename all variables to have the same name.
If you want to rename individual variables, select the aliasByName function from the function drop-down list. You can also stack this function with itself, using aliasByName_stacked which allows you to rename each variable. Here is an image that shows the 'aliasByName' function in a Query:
 aliasByName.PNG
Syntax: aliasByName(QUERY, name, Replacement String)
AliasByTime
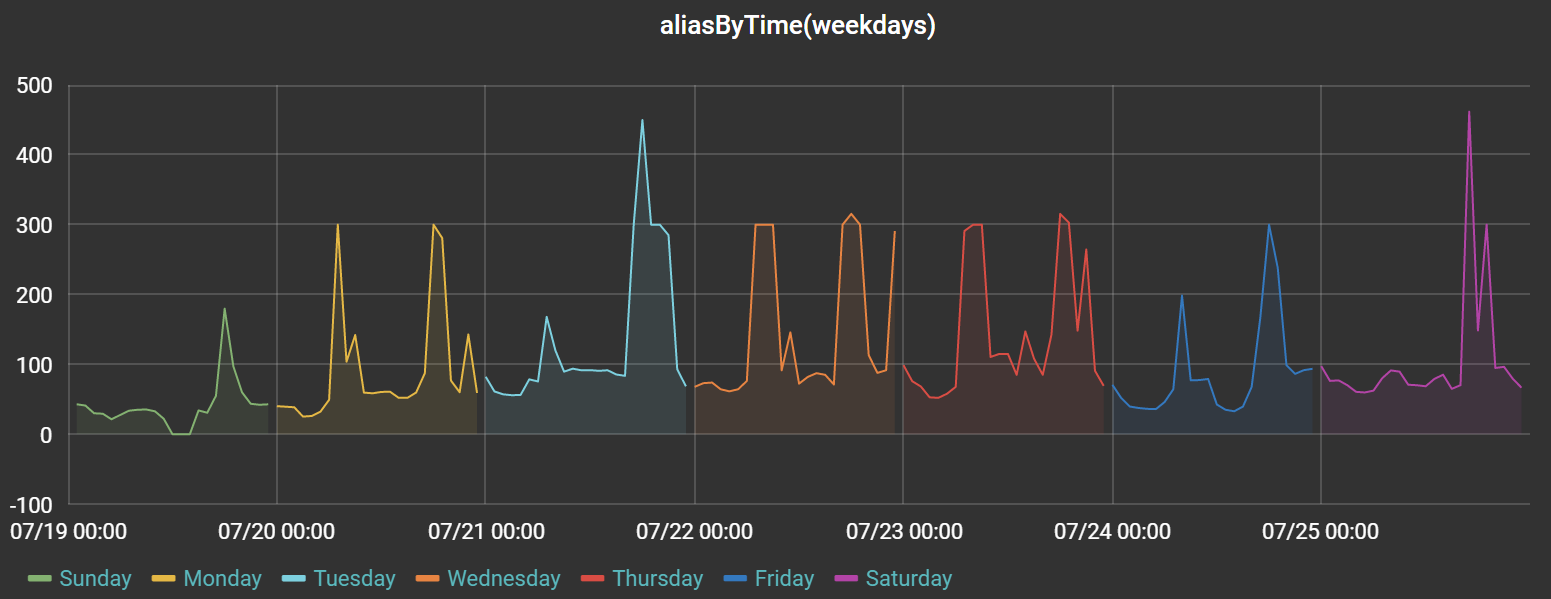
Returns grouped series under aliases based on time, and is useful for comparing data from different time periods. The input for aliasType can be weekdays, weekNumbers, months, or years. The timezoneOffset input adds a time offset from UTC in hours and can use positive or negative numbers.
Syntax: aliasByTime(QUERY, aliasType, timezoneOffset)
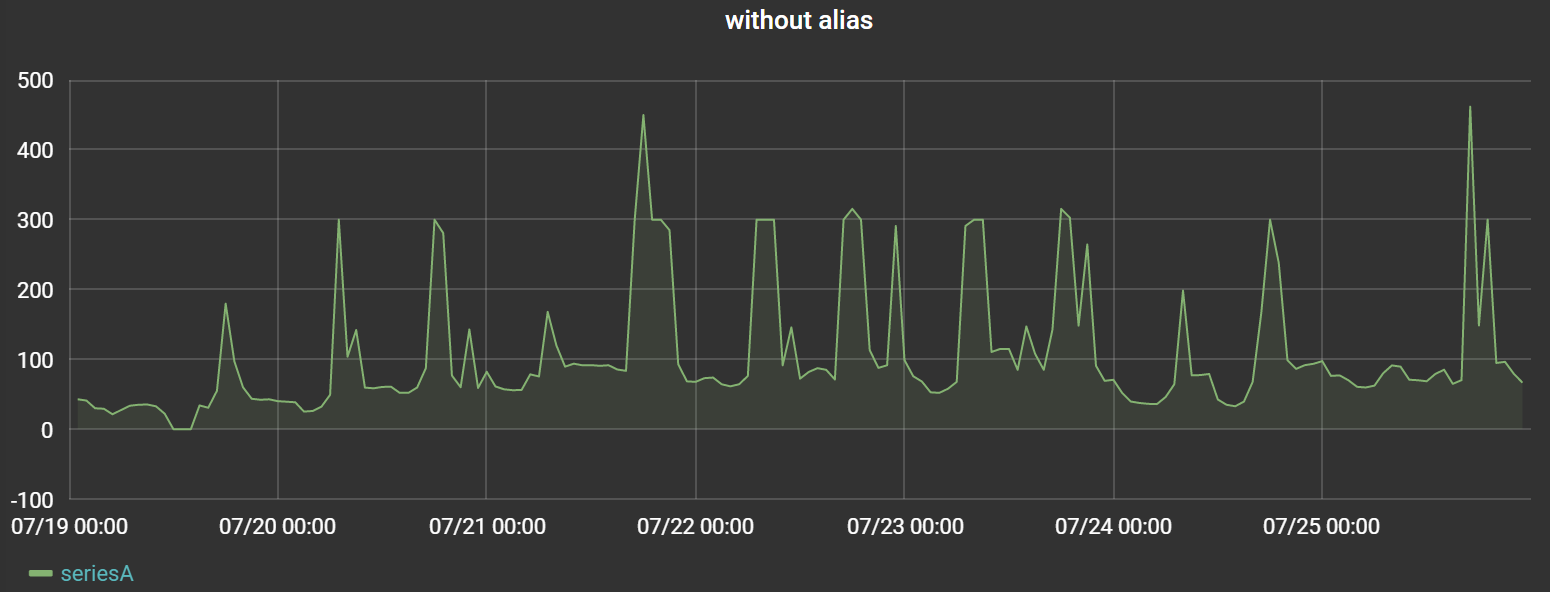
The first image below shows data returned with no AliasByTime function, followed by the same data, but grouped by the weekday of the data's timestamp:
IgnoreValue
Returns queried data without the value(s) specified, and is useful for filtering out certain values from a query.
Syntax: ignoreValue(QUERY, value)
Value input can be:
IgnoreVariable
Returns queried data without the variable(s) specified, and is useful for filtering variables when the query has a variable wildcard e.g.Asset/Aspect/*.
Syntax: ignoreVariable(QUERY, variable)
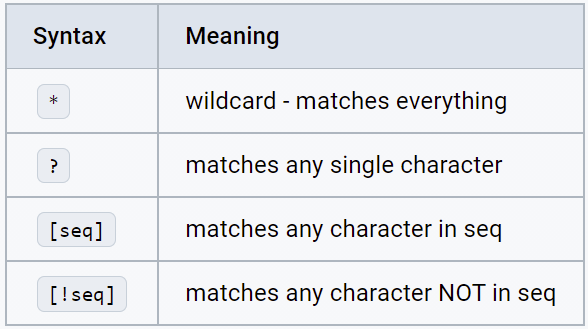
Variable input can be
For example, for this list of asset names, [Motor_12, Motor_15, Motor_17, Gear, Shaft], your input would be:
Syntax: Motor_* -> [Motor_12, Motor_15, Motor_17]
Motor_1[27] -> [Motor_12, Motor_17]
??a* -> [Gear, Shaft]
[MG]*[!57] -> [Motor_12, Gear]
Info
The 'ignoreVariable' function utilizes a Unix-style 'fnmatch' pattern and you can find more information here: https://docs.python.org/3/library/fnmatch.html
Math
Performs basic mathematical operations on returned variable data.
Math functions can be stacked, and they execute in the order written. Math functions apply to all data returned by the query. Here is an example:
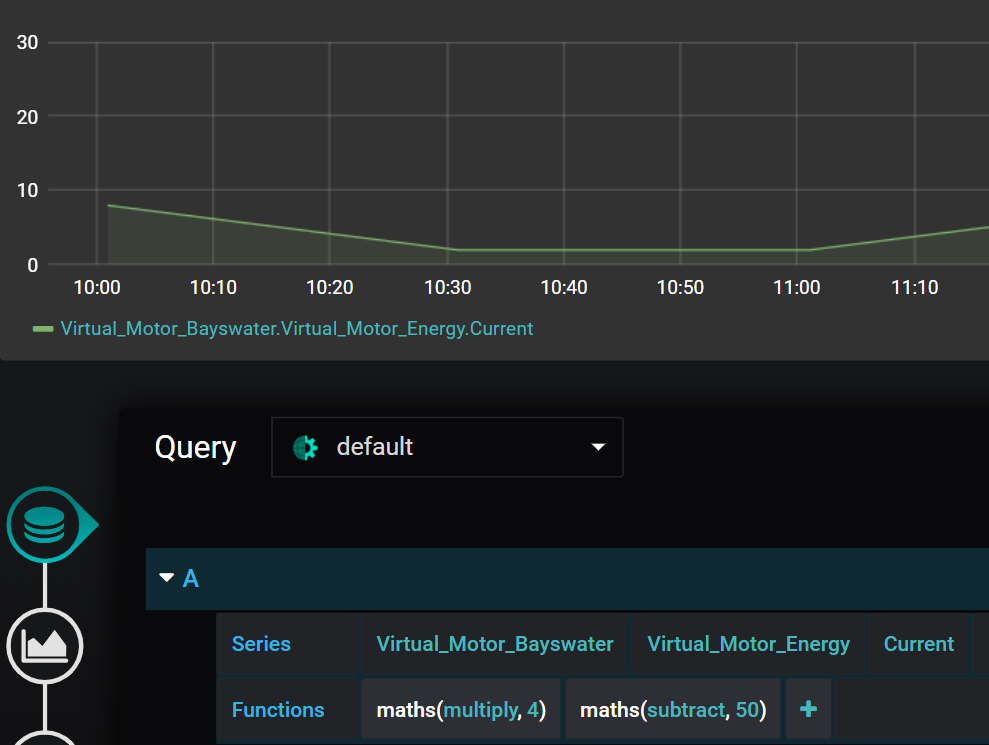
Syntax: maths(QUERY, function, value) or math_stacked
MSrawTimeseries
Returns raw data from a Insights Hub data source and overrides the default aggregation; instead, it returns non-aggregated or non-interpolated time series data.
When querying strings, use this function to retrieve the data, as Insights Hub's default aggregation cannot aggregate strings. This function can only retrieve up to the 2000 most-recent time series data points; a data point can contain multiple values if they share the same time index.
Syntax: MSrawTimeseries(QUERY)
MSassetID
Returns Insights Hub's Asset ID for the asset of the variable you select.
Syntax: MSassetID(QUERY)
MSmostRecentValueWithinTimeRange
Retrieves the most recent value within the queries time window using the IOT TimeSeries API.
If this function does not retrieve values reliably, please use MSaggregate(lastvalue).
This function retrieves the latest time index of the aspect that the variable is within. If the variable is not present in the latest time index it returns nothing. To avoid, try separating the data points you always wish to retrieve the last value of and put them in their own aspect or make sure their data is written to the latest time index.
Syntax: MSmostRecentValueWithinTimeRange(QUERY)
MSmostRecentValueWithinNowto90Days
Retrieves the most recent value within the last 90 days, using the IoT TimeSeries API, and regardless of the query's time window.
This function is useful for dashboards that look within a small range of time, such as a day, when you want to display the most recent value of less frequent data that does not fall within the time range. If this function does not retrieve values reliably, please use MSaggregate(lastvalue).
It retrieves the latest time index of an aspect that the variable is within. If the variable is not present in the latest time index it will return nothing. To avoid, try separating the data points. you always want to retrieve the last value of and put them in their own aspect or make sure their data is written to the latest time index.
Syntax: MSmostRecentValueWithinNowto90Days(QUERY)
MSboolAggregates
Returns a boolean value, according to automatically selected time ranges.
Standard Insights Hub aggregation rules cause boolean values to be misrepresented because the average aggregation rule causes the booleans to be displayed as decimals between 0 and 1.
This function aggregates the booleans and returns a boolean value by looking at the average value of booleans within the aggregated time range. If the value is below 0.5 it becomes a 0, if it is above it becomes a 1.
It allows aggregation of booleans, but still accurately represents them.
Syntax: MSboolAggregate(QUERY)
MSautoAggregate
Returns automatically aggregated data based on aggregation method.
Dashboard Designer Add On automatically calculates time ranges in order to automatically aggregate data using the 'average' aggregation method. This function gives power users the option to choose their own aggregation method, without having to calculate time ranges and groupings of data.
The IoT Time Series (TS) Aggregates Service creates aggregated summaries of numeric time series data and provides interfaces to read them. This allows applications to retrieve smaller datasets that cover a long time range with much better performance than processing all the raw time series data.
For example, an aspect could create new data every second, which adds up to ~2.5 million records per month. An application could use the IoT TS Aggregates Service to retrieve a summary for each day of the month, obtaining only 30 records.
Syntax: MSautoAggregate(QUERY, method)
MSaggregate
Returns aggregated data based on the specified intervals and method.
Dashboard Designer Add On automatically calculates time ranges to automatically aggregate data by default. This function gives users the option to fully customize how aggregates are calculated.
The IoT Time Series (TS) Aggregates Service creates aggregated summaries of numeric time series data and provides interfaces to read them. This allows applications to retrieve smaller data sets that cover a long time range with much better performance than processing all the raw time series data.
For example, an aspect could create new data every second, which adds up to ~2.5 million records per month. An application could use the IoT TS Aggregates Service to a summary for each day of the month, obtaining only 30 records.
Syntax: MSaggregate(QUERY, intervalUnit, intervalValue, method)
onlyChanges
Returns only the rising and falling edges of the query.
Syntax: onlyChanges(QUERY)
percentageOfTimeAs
Returns the amount of time each unique value was held as a percentage of the total time range, which is useful for displaying machine states and summarizing the time elapsed in each state.
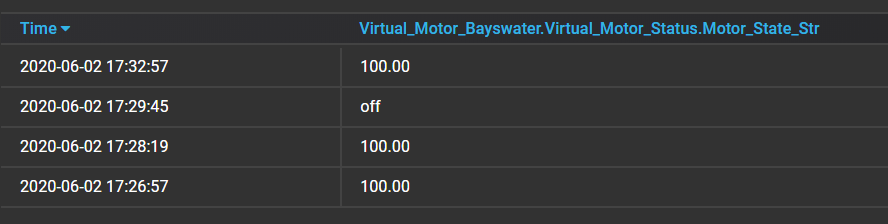
This function can also stack with other functions; for example, if a variable is a string, you can stack "percentageOfTimeAs" with "MSrawTimeseries", as shown here:
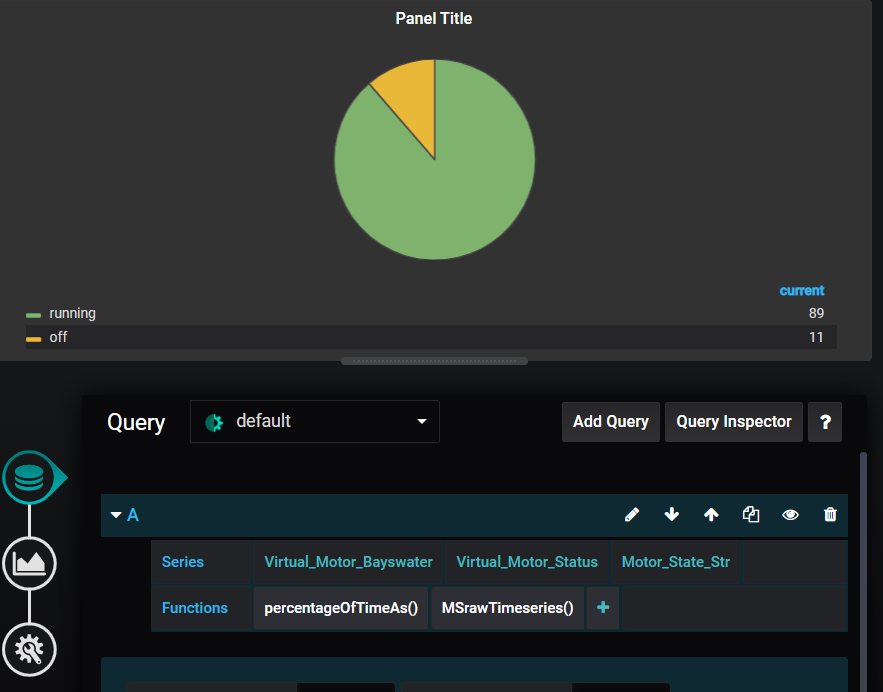
Syntax: PercentageOfTimeAs(QUERY)
StringToValue
Replaces strings with a number.
When displaying strings, such as in a table, you may need to change a word to a number or another descriptor, as shown here:
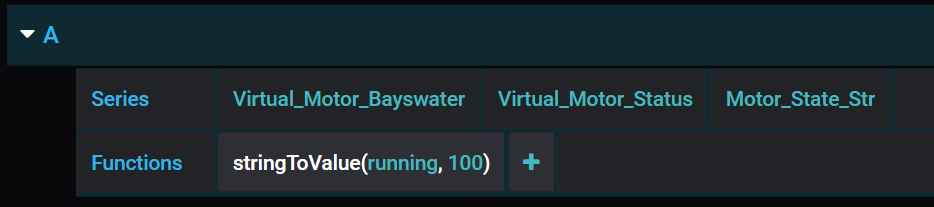
For example, whenever the string 'running' is found in the data it will be returned as the new designated value of '100':
Syntax: stringToValue(QUERY, string, replacementValue)
TimeOf
Returns the timestamp of the data points in Unix time. Use this function when you need to know the timestamp of a dataset, you can from the function.
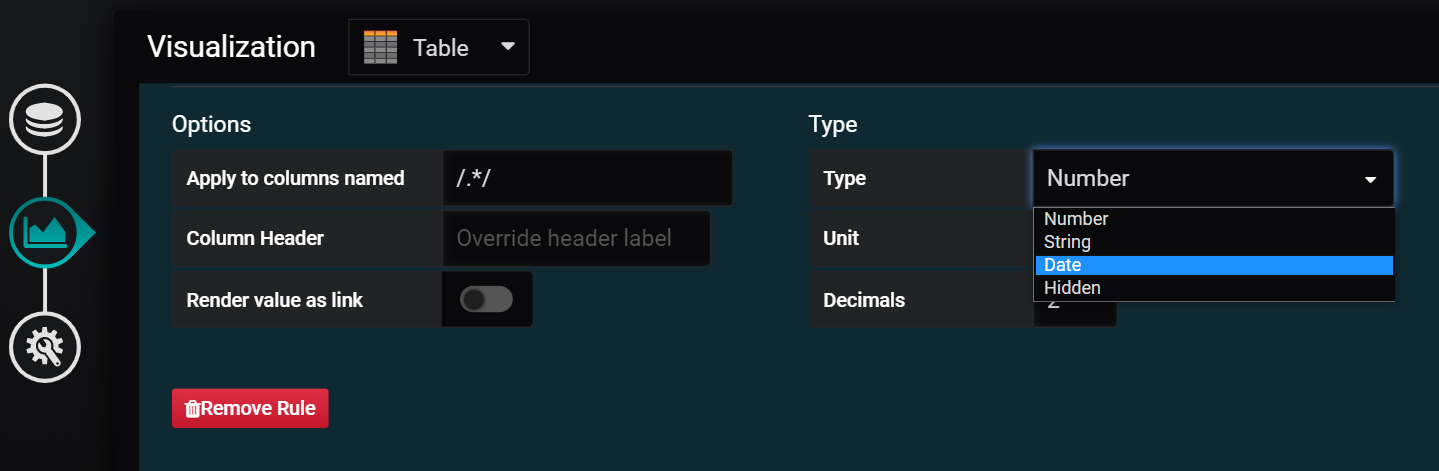
unixTime
Making timestamps more readable in a Table panel requires that you define the datatype as 'date' in the table options. Navigate to options in the visualization tab and select 'date' from the dropdown list next to 'type'.
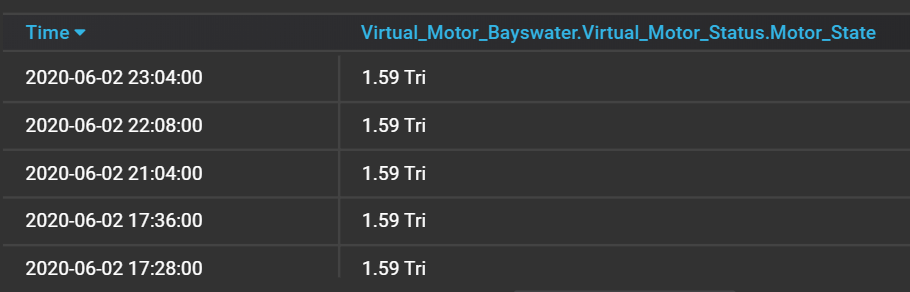
Because the timestamp is returned as a Unix timestamp, some additional steps may need to be carried out to make it more readable:
The results are much more readable:
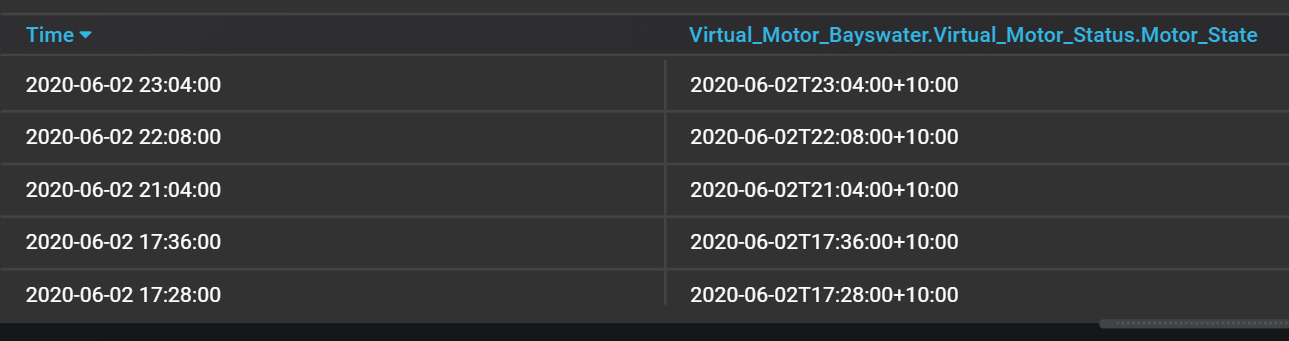
Syntax: timeOf(QUERY)
date_type
Displays the value in a human readable fashion.
Syntax: date_type
date_readable
Other panel types can also support dates (e.g. single stat). When using the timeOf function be sure to change the type or unit of the panel if it is to be displayed in a readable manner.
Syntax: date_readable
timeShift
Offsets a query by 86400 seconds (24 hours) by default. This is useful for overlaying data from the previous day with today's data, or overwriting the time zone of the data:
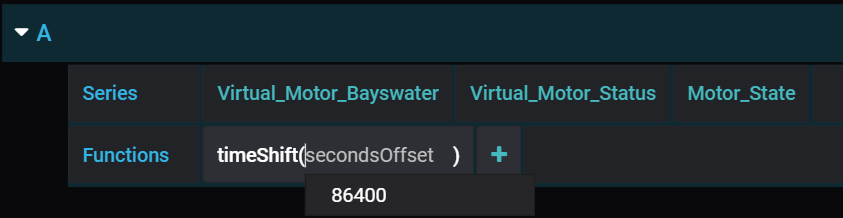
When you set up two queries for the same variable, you can overlay one with the offset and one without:
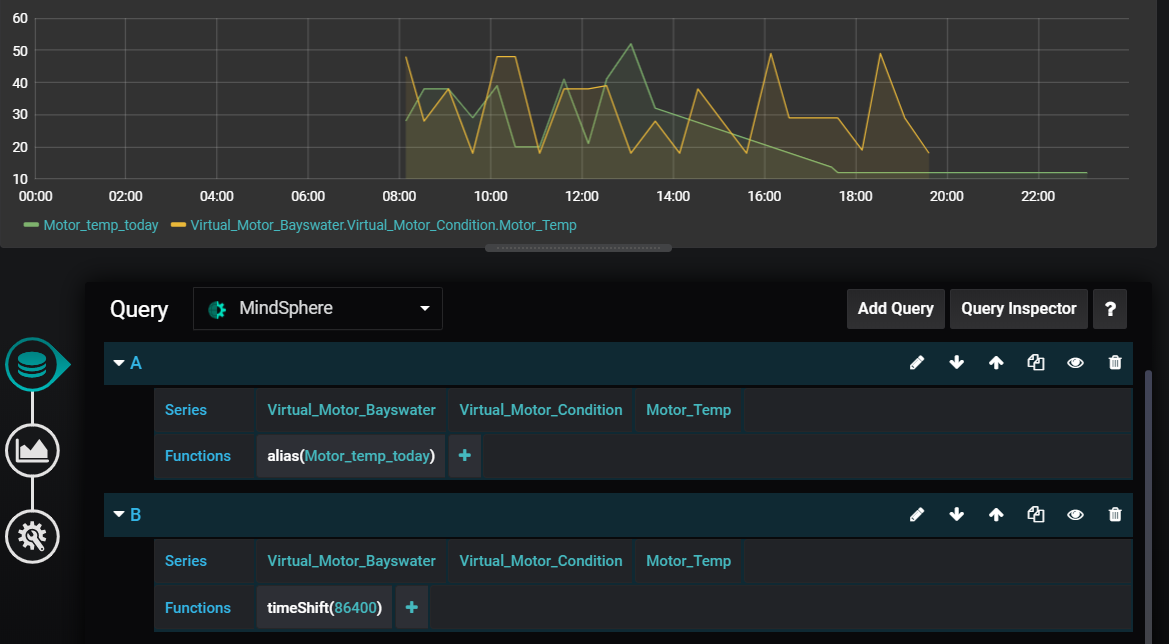
Syntax: timeShift
timeShift_noalias
When you notice that data displays with incorrect coloring and joining between points, this is because the graph colors and joins data based on its name. You can fix this by using the alias function to rename any variables that share the same name.
Syntax: timeShift_noalias
ValueToString
Replaces a value with a string. For example, in a table that displays machine state values, you can use this function to change the value to a more descriptive word:

Here is an example of a query looking for instances of "0" in the data and returning a user-selected string, "Machine_off":
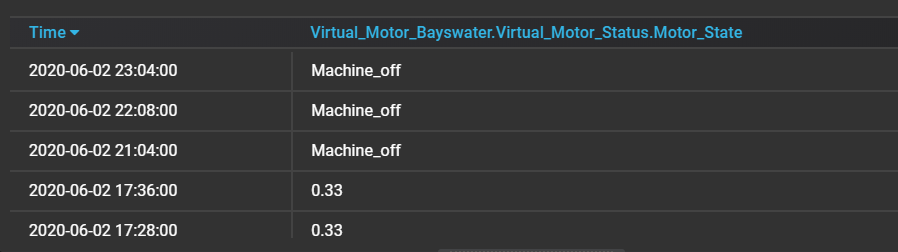
Syntax: valueToString(QUERY, value, replacementString)
valueToString_filled
When the value '0' is found in data, it returns the new designated string, for example, 'Machine_off'. Replacement strings do not support spaces.
Syntax: valueToString_filled(QUERY, value, replacementString)
VFCrequest
Creates a request to the http in blocks in Visual Flow Creator (VFC).
The method parameter in the VFCrequest function defines the method of the call. The format of the endpoint parameter requires an endpoint in this format:
/public/\<tenant>/\<route>?key=\<secret>
This function triggers a flow in VFC, and data can be returned from VFC to Dashboard Designer Add On for visualization, which requires a subscription and access to VFC.
There are also limitations with this function, including:
- Only the 'Get' method is supported and Dashboard Designer Add On selects it by default.
- Panels that use this function cannot have other queries added to the panel.
queryParams
Additional custom parameters sent to VFC as a part of the request. You can create a compatible flow in VFC by setting up the http in node as 'httpin_node'. Double click to open settings and enter the endpoint name to use.
Syntax: VFCrequest(method, endpoint, queryParams) httpin_endpoint
httpin_access
Changes the access method to public access using keys: httpin_generate, saves the flow, and copies the link address of the http in node.
httpin_key
As the endpoint parameter, this prepares the URL for use by the VFCrequest function in Dashboard Designer Add On.
When copying the URL, please remove the host URL preceding "/public".
The flow must have an "http out" at the end to cause VFC to respond, as shown in the example flows below.
Once the endpoint is created, the flow will run every time the panel refreshes.
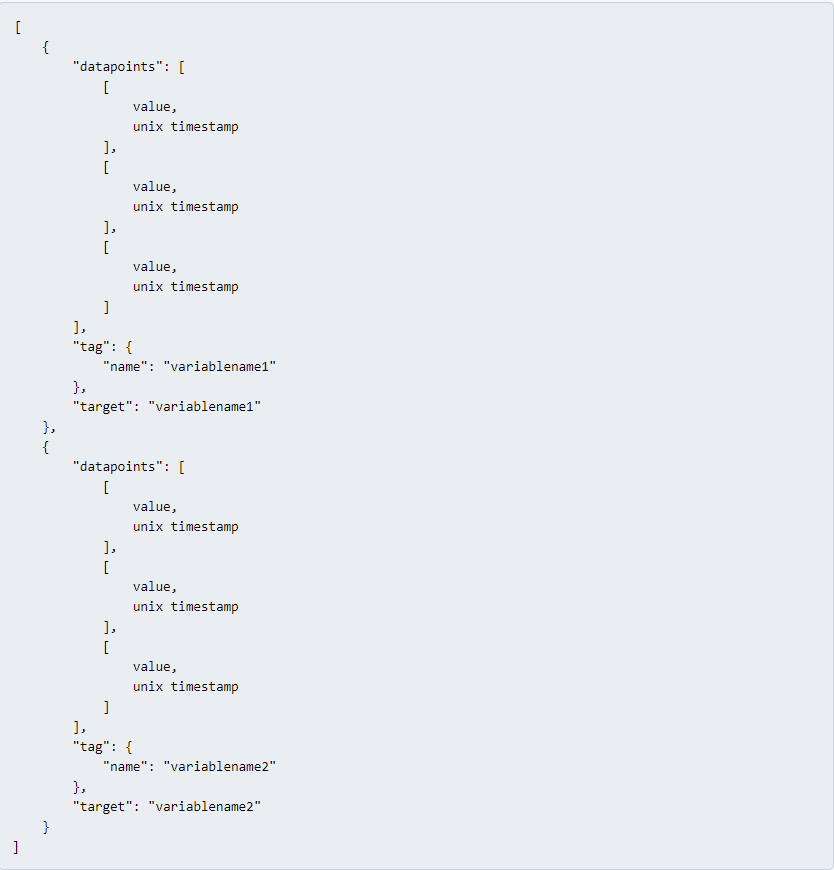
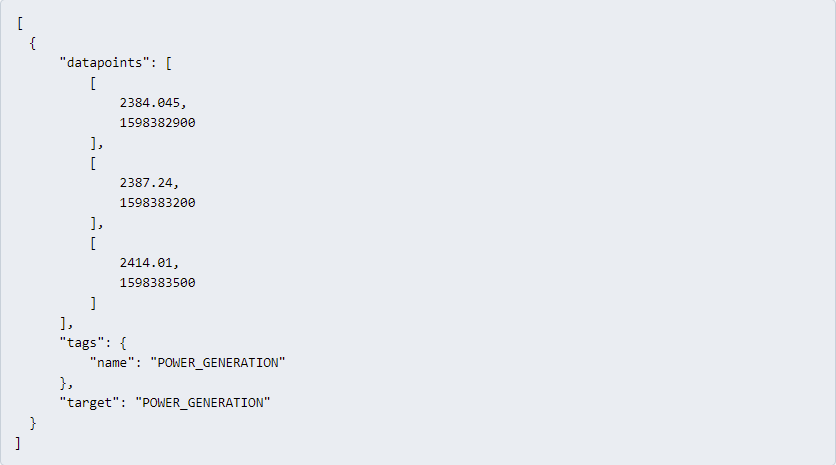
To trigger a VFC flow that displays data in Dashboard Designer Add On, use the following JSON structure:
Here is an example that uses real data:
Security information
Creating an http in node with a public access key means that the particular flow triggered by the http in node can potentially be accessed externally. Thus, it is important to protect your data and prevent unauthorized access. Please handle the access keys with care.
Creating an Access Control Node
Create an "access control" node after the http in node so it's possible to determine that the flow is being requested by Dashboard Designer Add On.
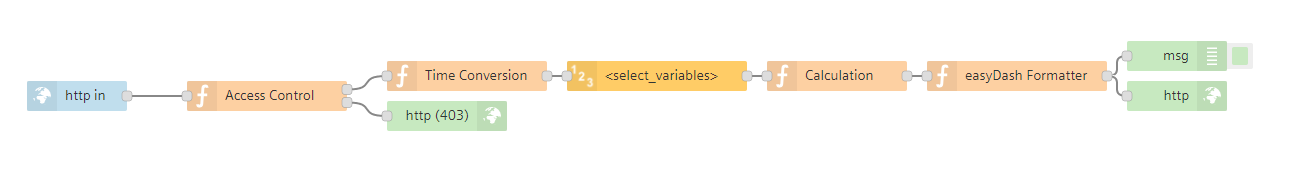
This 'access control' node, shown above, is a function node with this code:
Example Flows
Follow these steps to import the example flow code:
- Copy the code displayed below to your clipboard.
- Open Visual Flow Creator.
- Select "Import" and "New flow" from the app menu and paste the code.
!! note Where https://
Double click the ReadMe nodes for more information.
Basic Flow Example
[
{
    "id": "6dc5e5d4.be494c",
    "type": "comment",
    "z": "392f23c2.fd446c",
    "name": "Read me",
    "info": "Access Control Node:\n    The access control node is to reduce the risks of using a public key.\n    This node checks the referer of the incoming request - if the referer does \n    not match the expected origin (the  Dashboard Designer Add On data source) \n    then an error 403 \"forbidden\" will be returned to the requester.\n    \n    \n\nTime Conversion Node:\n    Converts Dashboard Designer Add On timestamps to the format that VFC uses \n    \nRead Timeseries Node:\n    Select the variable(s) you wish to manipulate and display. \n    Make sure that the \"Mode\" is set to \"Interval\" and that the interval fields \n    are left blank if you want the time range to match that of the dashboard \n    making the request.\n    \n\"Calculation\" Function Node:\n    The Calculation node in this example flow is a Function node and has a very\n    simple calculation - it divides all the values by 2.\n    \n\"Dashboard Designer Add On Formatter\" Function Node:\n    This is an example node which provides a method of converting a typical\n    MindSphere response and a typical analytics node response. \n    If custom analytics functions are being implemented then it is likely that\n    this node will need adjustment.",
    "sticky": 0,
    "x": 340,
    "y": 1200,
    "wires": [],
    "_type": "node"
},
{
    "id": "11c225e8.96268a",
    "type": "debug",
    "z": "392f23c2.fd446c",
    "name": "",
    "active": true,
    "console": "false",
    "xaxis": "_time",
    "complete": "true",
    "x": 1250,
    "y": 1220,
    "wires": []
},
{
    "id": "5bc50450.2a2fec",
    "type": "function",
    "z": "392f23c2.fd446c",
    "name": "Access Control",
    "func": "let refererURL = \"https://<tenantname>-dashboarddesigner-datasource\";\nif(msg.req.headers.referer == refererURL){\nreturn [msg,null];    \n}else{\n    console.log(\"Forbidden\");\n    msg = {};\n    msg.statusCode = 403;\n    \n    return [null,msg];\n}\n",
    "outputs": "2",
    "noerr": 0,
    "x": 340,
    "y": 1260,
    "wires": [
        [
            "e8fdc546.0c8628"
        ],
        [
            "37466b30.e8dfa4"
        ]
    ]
},
{
    "id": "e8fdc546.0c8628",
    "type": "function",
    "z": "392f23c2.fd446c",
    "name": "Time Conversion",
    "func": "msg.from = new Date(parseInt(msg.req.query.from));\nmsg.to = new Date(parseInt(msg.req.query.to));\nreturn msg;",
    "outputs": 1,
    "noerr": 0,
    "x": 540,
    "y": 1240,
    "wires": [
        [
            "285dd047.2206f"
        ]
    ]
},
{
    "id": "f09ef087.5c316",
    "type": "function",
    "z": "392f23c2.fd446c",
    "name": "Calculation",
    "func": "for (let i in msg.payload){ \n    for (let key in msg.payload[i]) {\n        if (key != \"_time\") {\n            msg.payload[i][key] = (msg.payload[i][key]/2);\n        }\n    }\n}\n\nreturn msg;",
    "outputs": 1,
    "noerr": 0,
    "x": 910,
    "y": 1240,
    "wires": [
        [
            "fe227dcc.84658"
        ]
    ]
},
{
    "id": "fe227dcc.84658",
    "type": "function",
    "z": "392f23c2.fd446c",
    "name": "Dashboard_Designer Formatter",
    "func": "let msVariables = {};\n\n// this function makes a number of assumptions about the data coming in and was written for data outputs of the VFC analytics nodes\nif(!Array.isArray(msg.payload)){ // this function check to see if the payload is an array, which is required for the Dashboard_Designer formatting\n    console.log(\"payload is not the correct format, attempting to readjust\"); \n    if(typeof(msg.payload)!=='object' && msg.parameter){\n        msg.payload = { [msg.parameter]: msg.payload };\n    }\n    if(!msg.payload._time){ // assuming there is only one data point in the payload that triggers this function - typical outputs of analytics nodes will have one value and no timestamp - this ensures the data will populate the panel in Dashboard_Designer\n        msg.payload._time = msg.to;\n    }\n    msg.payload = [msg.payload]; // once the above checks have been made we must make an array for the next function to execute properly.\n}\nif(Array.isArray(msg.payload)){\n    for (let i in msg.payload){ \n        for (let key in msg.payload[i]) {\n            if (key != \"_time\") {\n                if (!msVariables[key]) {\n                    msVariables[key] = { \"datapoints\": [], \"tag\": {\"name\": key}, \"target\": key }; //our Dashboard_Designer object\n                }\n                msVariables[key].datapoints.push([msg.payload[i][key],new Date(msg.payload[i]._time).getTime()/1000]);\n            }\n        }\n    }\n    msg.payload = [];\n    for (let i in msVariables) {\n        msg.payload.push(msVariables[i]);\n    }\n    return msg;\n}else{\n    console.log(\"Data could not be formatted correctly\");\n}\n",
    "outputs": 1,
    "noerr": 0,
    "x": 1090,
    "y": 1240,
    "wires": [
        [
            "11c225e8.96268a",
            "3c3e8ca3.ac8b14"
        ]
    ]
},
{
    "id": "9368a33c.14e98",
    "type": "http in",
    "z": "392f23c2.fd446c",
    "name": "http in",
    "endpoint": "",
    "method": "get",
    "upload": false,
    "access": "private",
    "key": "",
    "users": "",
    "x": 170,
    "y": 1260,
    "wires": [
        [
            "5bc50450.2a2fec"
        ]
    ]
},
{
    "id": "3c3e8ca3.ac8b14",
    "type": "http response",
    "z": "392f23c2.fd446c",
    "name": "",
    "statusCode": "",
    "headers": {},
    "x": 1250,
    "y": 1260,
    "wires": []
},
{
    "id": "37466b30.e8dfa4",
    "type": "http response",
    "z": "392f23c2.fd446c",
    "name": "",
    "statusCode": "403",
    "headers": {},
    "x": 520,
    "y": 1280,
    "wires": []
},
{
    "id": "285dd047.2206f",
    "type": "read timeseries",
    "z": "392f23c2.fd446c",
    "name": "",
    "topic": "",
    "topicLabel": "",
    "assetName": "",
    "period": "60",
    "offset": "0",
    "mode": "interval",
    "from": "",
    "datetimepickerFrom": "",
    "to": "",
    "datetimepickerTo": "",
    "timezoneoffset": 0,
    "x": 720,
    "y": 1240,
    "wires": [
        [
            "f09ef087.5c316"
        ]
    ]
}
]
Analytics Example: Moving Average
 [
{
    "id": "693080.833c5f8",
    "type": "comment",
    "z": "392f23c2.fd446c",
    "name": "Read me",
    "info": "Access Control Node:\n    The access control node is to reduce the risks of using a public key.\n    This node checks the referer of the incoming request - if the referer does \n    not match the expected origin (the Dashboard_Designer data source) \n    then an error 403 \"forbidden\" will be returned to the requester.\n\n \n\nTime Conversion Node:\n    Converts Dashboard_Designer timestamps to the format that VFC uses \n    \nRead Timeseries Node:\n    Select the variable(s) you wish to manipulate and display. \n    Make sure that the \"Mode\" is set to \"Interval\" and that the interval fields \n    are left blank if you want the time range to match that of the dashboard \n    making the request.\n    \n\"Dashboard_Designer Formatter\" Function Node:\n    This is an example node which provides a method of converting a typical\n    MindSphere response and a typical analytics node response. \n    If custom analytics functions are being implemented then it is likely that\n    this node will need adjustment.",
    "sticky": 0,
    "x": 320,
    "y": 1440,
    "wires": [],
    "_type": "node"
},
{
    "id": "4dea3605.6899e8",
    "type": "debug",
    "z": "392f23c2.fd446c",
    "name": "",
    "active": true,
    "console": "false",
    "xaxis": "_time",
    "complete": "true",
    "x": 1230,
    "y": 1460,
    "wires": []
},
{
    "id": "2ec0625a.b5ad7e",
    "type": "function",
    "z": "392f23c2.fd446c",
    "name": "Access Control",
    "func": "let refererURL = \"https:// Dashboard_Designer-datasource-silopsms.apps.eu1.mindsphere.io\";\nif(msg.req.headers.referer == refererURL){\nreturn [msg,null];    \n}else{\n    console.log(\"Forbidden\");\n    msg = {};\n    msg.statusCode = 403;\n    \n    return [null,msg];\n}\n",
    "outputs": "2",
    "noerr": 0,
    "x": 320,
    "y": 1500,
    "wires": [
        [
            "aee3ad9b.e4ad"
        ],
        [
            "62e6b5bb.c58bcc"
        ]
    ]
},
{
    "id": "aee3ad9b.e4ad",
    "type": "function",
    "z": "392f23c2.fd446c",
    "name": "Time Conversion",
    "func": "msg.from = new Date(parseInt(msg.req.query.from));\nmsg.to = new Date(parseInt(msg.req.query.to));\nreturn msg;",
    "outputs": 1,
    "noerr": 0,
    "x": 520,
    "y": 1480,
    "wires": [
        [
            "8ab9a317.bcd2a"
        ]
    ]
},
{
    "id": "f0f3fae1.aff638",
    "type": "function",
    "z": "392f23c2.fd446c",
    "name": "Dashboard_Designer Formatter",
    "func": "let msVariables = {};\n\n// this function makes a number of assumptions about the data coming in and was written for data outputs of the VFC analytics nodes\nif(!Array.isArray(msg.payload)){ // this function check to see if the payload is an array, which is required for the Dashboard_Designer formatting\n    console.log(\"payload is not the correct format, attempting to readjust\"); \n    if(typeof(msg.payload)!=='object' && msg.parameter){\n        msg.payload = { [msg.parameter]: msg.payload };\n    }\n    if(!msg.payload._time){ // assuming there is only one data point in the payload that triggers this function - typical outputs of analytics nodes will have one value and no timestamp - this ensures the data will populate the panel in Dashboard_Designer\n        msg.payload._time = msg.to;\n    }\n    msg.payload = [msg.payload]; // once the above checks have been made we must make an array for the next function to execute properly.\n}\nif(Array.isArray(msg.payload)){\n    for (let i in msg.payload){ \n        for (let key in msg.payload[i]) {\n            if (key != \"_time\") {\n                if (!msVariables[key]) {\n                    msVariables[key] = { \"datapoints\": [], \"tag\": {\"name\": key}, \"target\": key }; //our Dashboard_Designer object\n                }\n                msVariables[key].datapoints.push([msg.payload[i][key],new Date(msg.payload[i]._time).getTime()/1000]);\n            }\n        }\n    }\n    msg.payload = [];\n    for (let i in msVariables) {\n        msg.payload.push(msVariables[i]);\n    }\n    return msg;\n}else{\n    console.log(\"Data could not be formatted correctly\");\n}\n",
    "outputs": 1,
    "noerr": 0,
    "x": 1070,
    "y": 1480,
    "wires": [
        [
            "4dea3605.6899e8",
            "ee0fa9f.f331758"
        ]
    ]
},
{
    "id": "b19229df.5310f8",
    "type": "http in",
    "z": "392f23c2.fd446c",
    "name": "",
    "endpoint": "",
    "method": "get",
    "upload": false,
    "access": "private",
    "key": "",
    "users": "",
    "x": 170,
    "y": 1500,
    "wires": [
        [
            "2ec0625a.b5ad7e"
        ]
    ]
},
{
    "id": "ee0fa9f.f331758",
    "type": "http response",
    "z": "392f23c2.fd446c",
    "name": "",
    "statusCode": "",
    "headers": {},
    "x": 1230,
    "y": 1500,
    "wires": []
},
{
    "id": "62e6b5bb.c58bcc",
    "type": "http response",
    "z": "392f23c2.fd446c",
    "name": "",
    "statusCode": "403",
    "headers": {},
    "x": 500,
    "y": 1520,
    "wires": []
},
{
    "id": "63fcd020.91557",
    "type": "moving average",
    "z": "392f23c2.fd446c",
    "name": "",
    "parameter": "",
    "parameterout": "",
    "windowSize": 3,
    "algorithm": "simple",
    "alpha": 0.5,
    "x": 880,
    "y": 1480,
    "wires": [
        [
            "f0f3fae1.aff638"
        ]
    ]
},
{
    "id": "8ab9a317.bcd2a",
    "type": "read timeseries",
    "z": "392f23c2.fd446c",
    "name": "",
    "topic": "",
    "topicLabel": "",
    "assetName": "",
    "period": "60",
    "offset": "0",
    "mode": "interval",
    "from": "",
    "datetimepickerFrom": "",
    "to": "",
    "datetimepickerTo": "",
    "timezoneoffset": 0,
    "x": 700,
    "y": 1480,
    "wires": [
        [
            "63fcd020.91557"
        ]
    ]
}
]
Access Query Parameters Sent to VFC
 [
{
    "id": "3703d4c5.4b51ac",
    "type": "comment",
    "z": "392f23c2.fd446c",
    "name": "Read me",
    "info": "This flow provides an example of how the query parameters can be accessed from within a Visual Flow Creator flow.",
    "sticky": 0,
    "x": 540,
    "y": 1600,
    "wires": [],
    "_type": "node"
},
{
    "id": "1edecaa1.50b9b5",
    "type": "function",
    "z": "392f23c2.fd446c",
    "name": "Access Control",
    "func": "let refererURL = \"https:// Dashboard_Designer-datasource-silopsms.apps.eu1.mindsphere.io\";\nif(msg.req.headers.referer == refererURL){\nreturn [msg,null];    \n}else{\n    console.log(\"Forbidden\");\n    msg = {};\n    msg.statusCode = 403;\n    \n    return [null,msg];\n}\n",
    "outputs": "2",
    "noerr": 0,
    "x": 551.5,
    "y": 1661,
    "wires": [
        [
            "3f44162d.f2f52a"
        ],
        [
            "fcfa3a54.111b18"
        ]
    ]
},
{
    "id": "3f44162d.f2f52a",
    "type": "function",
    "z": "392f23c2.fd446c",
    "name": "debug query param",
    "func": "console.log(msg.req.query.exampleQueryParam);\n\nreturn msg;",
    "outputs": 1,
    "noerr": 0,
    "x": 761.5,
    "y": 1641,
    "wires": [
        []
    ]
},
{
    "id": "e9b94d90.5d4a6",
    "type": "http in",
    "z": "392f23c2.fd446c",
    "name": "",
    "endpoint": "",
    "method": "get",
    "upload": false,
    "access": "private",
    "key": "",
    "users": "",
    "x": 381.5,
    "y": 1661,
    "wires": [
        [
            "1edecaa1.50b9b5"
        ]
    ]
},
{
    "id": "fcfa3a54.111b18",
    "type": "http response",
    "z": "392f23c2.fd446c",
    "name": "",
    "statusCode": "403",
    "headers": {},
    "x": 731.5,
    "y": 1681,
    "wires": []
}
 ]
string_table
Note: Replacement strings do not support spaces.
VFCrequest
Creates a request to the http in blocks in Visual Flow Creator (VFC). Data can be returned from VFC to Dashboard Designer for visualization. This requires a subscription and access to Visual Flow Creator.
Important Points About VFC Requests:
- Only the GET method is currently supported and is selected by default.
- A panel that uses VFCrequest cannot have additional queries in the same panel.
- No asset query is required for this function, as the data is retrieved via Visual Flow Creator.
- The method parameter defines the method of the call.
The format of the endpoint parameter requires an endpoint which follows this format:
/public/<tenant>/<route>?key=<secret>.

Syntax: VFCrequest(method, endpoint, queryParams)
queryParams
Additional custom parameters that can be sent to VFC as a part of the request; this creates a compatible flow in Visual Flow Creator when you set up the http in node in Visual Flow Creator.
httpin_node
Double click to open the settings and enter the endpoint name that you wish to use.
httpin_endpoint
Changes the Access method to Public access using keys.
httpin_generate
Save this flow and copy the link address of the http in node.
httpin_key
The URL used by the VFCrequest function as the endpoint parameter. If you copied the URL manually, be sure to remove the host URL preceding /public. For Visual Flow Creator to respond, the flow should have an http out at the end as seen in the example flows below.
Once the endpoint is created, the flow will run every time the panel refreshes, as long as it is formatted correctly. Dashboard Designer Add On can only display the data configured with the correct JSON structure, as shown in the example below.
Security Information
Creating an http in node with a public access key means that the particular flow triggered by the http in node can potentially be accessed externally. Thus, it is important to protect your data and prevent unauthorized access. Please handle the access keys with care.
It is recommended to create an "access control" node after the http in node so that the flow can determine if the flow is being requested by Dashboard Designer Add On.
The "access control" node shown above is a function node with the code:
Importing an Example Flow
To import an example flow from below, copy the code and select Import > new flow from the app menu in Visual Flow Creator. Double-click the Read me nodes for more information.
Example: Access Query Parameters Sent to VFC
[
{
    "id": "3703d4c5.4b51ac",
    "type": "comment",
    "z": "392f23c2.fd446c",
    "name": "Read me",
    "info": "This flow provides an example of how the query parameters can be accessed from within a Visual Flow Creator flow.",
    "sticky": 0,
    "x": 540,
    "y": 1600,
    "wires": [],
    "_type": "node"
},
{
    "id": "1edecaa1.50b9b5",
    "type": "function",
    "z": "392f23c2.fd446c",
    "name": "Access Control",
    "func": "let refererURL = \"https://Dashboard_Designer-datasource-silopsms.apps.eu1.mindsphere.io\";\nif(msg.req.headers.referer == refererURL){\nreturn [msg,null];    \n}else{\n    console.log(\"Forbidden\");\n    msg = {};\n    msg.statusCode = 403;\n    \n    return [null,msg];\n}\n",
    "outputs": "2",
    "noerr": 0,
    "x": 551.5,
    "y": 1661,
    "wires": [
        [
            "3f44162d.f2f52a"
        ],
        [
            "fcfa3a54.111b18"
        ]
    ]
},
{
    "id": "3f44162d.f2f52a",
    "type": "function",
    "z": "392f23c2.fd446c",
    "name": "debug query param",
    "func": "console.log(msg.req.query.exampleQueryParam);\n\nreturn msg;",
    "outputs": 1,
    "noerr": 0,
    "x": 761.5,
    "y": 1641,
    "wires": [
        []
    ]
},
{
    "id": "e9b94d90.5d4a6",
    "type": "http in",
    "z": "392f23c2.fd446c",
    "name": "",
    "endpoint": "",
    "method": "get",
    "upload": false,
    "access": "private",
    "key": "",
    "users": "",
    "x": 381.5,
    "y": 1661,
    "wires": [
        [
            "1edecaa1.50b9b5"
        ]
    ]
},
{
    "id": "fcfa3a54.111b18",
    "type": "http response",
    "z": "392f23c2.fd446c",
    "name": "",
    "statusCode": "403",
    "headers": {},
    "x": 731.5,
    "y": 1681,
    "wires": []
}
]